- Subscribe to RSS Feed
- Mark as New
- Mark as Read
- Bookmark
- Subscribe
- Printer Friendly Page
- Report Inappropriate Content
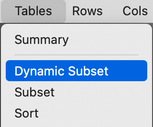
Install Add-In, then launch from main menu: Tables > Dynamic Subset
Purpose:
This Add-In creates a Dynamic Subset, which is a filterable view of your open data table so you can view only the rows and columns that meet the conditions you specify.
Video Example:
Instructions For Use:
- First download, then open the Add-In to install the new menu item "Dynamic Subset" to your Tables Menu.
- With a data table already open, select the menu item Tables > Dynamic Subset. A new window will open with a linked subset of your original table, including two outline boxes on the right, Columns Filter and Data Filter.
- The Columns Filter outline box allows you to select which columns you wish to see in your Dynamic Subset.
- The Data Filter outline box contains a JMP Data Filter where you can specify criteria your data must meet to be displayed in the Dynamic Subset.
- To use the Columns Filter, select the columns you wish to see in the Dynamic Subset. Hit Clear, or deselect all columns to show all available columns in the Dynamic Subset.
- To use the Data Filter, select a column or columns to filter based on and click the plus sign. Then, in the resulting selection areas pick what criteria your data must meet in order to be included in the Dynamic Subset. For more details on using the JMP Data filter, see this example video (Using the Local Data Filter ), or read about it in the JMP documentation.
- After making selections you can use JMP platforms as usual on your Dynamic Subset and only the rows and columns you have selected will be available and used for analysis.
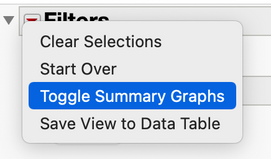
- Save a view by selecting the Red Triangle next to Filters > Save View to Data Table. This will save a script to the data table with the necessary information to recreate your Dynamic Subset. You can apply this view from inside of an existing Dynamic Subset, or launch directly from your table if no Dynamic Subset is already open.
Usage Notes:
- If you first select columns in your original table table, then select Add-Ins > Dynamic Subset, the columns selected will be automatically added as filterable criteria in the Data Filter section.
- The Dynamic Subset is a linked subset of your original table, so the selections you make in the Dynamic Subset will select the corresponding rows in your original table.
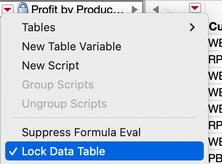
- The Dynamic Subset is locked by default. To unlock, select the Red Triangle next to the table name, and uncheck "Lock Data Table."
Note that, as is the case with any linked subset in JMP, many changes you make in Dynamic Subset will not impact the original table, such as making new columns. Alterations to data in cells and column properties will impact your original table. Any adjustments you make to the columns or data filter will revert your table back to your original table. - You can select Tables > Dynamic Subset with no table open and you will be prompted to pick a table. In this case, the original table is hidden from view by default, but can be shown by selecting the table under the menu item Window > Hidden.
Very cool tool. In particular, this can be very useful for recoding for one needs to be aware of the content of related columns when the 'lock data table' function is deselected.
Under those conditions. It would be very helpful if there was also a way (1) to instead of a subset to have the ability to summarize and dynamically filter as is presently the case and (2) to have the ability to capture the changes in a script.
Very nice.
Would it be useful to display dynamic data filters as well? Distributions should change with the row selection. Perhaps having a button that allows the user to refine those manually?
@Sburel : can you tell me a bit more about what you're imagining there? If you're aiming to have some summarization of the data and want to dynamically filter it, you might be able to pull that off using Analyze > Tabulate, then once you have the tabulation set up, add the Local Data Filter, which you can get to from the Red Triangle > Local Data Filter. In this way you can dynamically filter the tabulation and see those summary statistics change based on the subset you have defined.
@FN: The way this is written right now it isn't possible for the rows selected in the table to affect the histograms attached to the filters, but perhaps we can go the other way around.
I think there are two ways you could go about this to see histograms. The first is to toggle on the summary graphs on the table. To do that, select the Red Triangle next to "Filters," and then select "Toggle Summary Graphs." Now, when you change the filters you will see the histograms update for each column.
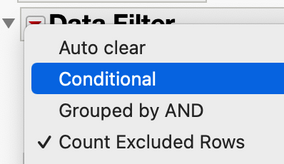
Another option is making your filters conditional. You can do this by selecting the Red Triangle next to "Data Filter," then Conditional:
By doing this, once you set a filter, the remaining filters only show the values remaining in the subset defined by the previous filters.
I hope this helps!
@julian what I have in mind is some sort of dynamic summary filtering that can be used for 'relative' recoding. For instance, you may have a large table but you might be interested only in a few columns. In those columns, you might many redundant terms when using the current version which gives you a dynamic subset.
The option to see only the unique terms for a select bunch of columns would make it easier to do modifications while keeping an eye on the relationship between terms something that cannot be done easily when using the recode function.
I'm attaching an example table in which the type 1 and type 2 columns would be examined using your addin. One term is wrong. In a summary scenario combined to dynamic filtering, it would easier to identify the error and fix it.
New Table( "veggies",
	Add Rows( 18 ),
	New Column( "Column 1",
		Character,
		"Nominal",
		Set Values(
			{"a", "b", "c", "d", "d", "e", "f", "g", "h", "i", "j", "k", "l", "m",
			"n", "o", "p", "q"}
		)
	),
	New Column( "Type 1",
		Character,
		"Nominal",
		Set Selected,
		Set Values(
			{"tomatoes", "tomatoes", "tomatoes", "apple", "apple", "apple",
			"carrots", "carrots", "carrots", "tomatoes", "tomatoes", "tomatoes",
			"apple", "apple", "apple", "carrots", "carrots", "carrots"}
		)
	),
	New Column( "type 2",
		Character,
		"Nominal",
		Color Cells( {69, {17}} ),
		Set Selected,
		Set Values(
			{"red", "green", "green", "red", "green", "red", "red", "red", "green",
			"red", "green", "green", "red", "green", "red", "red", "blue", "green"}
		),
		Set Display Width( 55 )
	)
)
@Sburel : I do think I understand what you're trying to do there, and I can see how that might be complicated with a larger table to track things down. I'm not sure I can't think of a straightforward way to adapt this Add-In to do this sort of thing. But, I wonder if a platform like Fit Y by X or even Graph Builder might be useful to detect those anomalous levels that occur at the intersection of two categorical variables. For example, a mosaic plot does a nice job showing the unique intersections, and visually it will be obvious when there is something that doesn't fit. For instance, in your example:
@julian The Fit X by Y would not be useful in the context of recoding and/or for very large lists (>100s of rows). What about having the option when several columns are already selected to have the option to run the summary on the selected columns while linked to the original table and then display the dynamic filter on the resulting summary table? I tried that way but it does not seem to allow for modification of the resulting table despite the option 'lock data table' being disabled.
Hi @Sburel,
I think I better understand what you're after. I don't think we can accomplish it exactly because of the way linked subsets work with changing values (there isn't a way I can script things so that values changed in a summary table will change all those value in the original table). However, I think there's something you can do here, which is to make a summary table first, and then use a Dynamic Subset on that to track down the anomalous values. Here's a pretty contrived example using a sample data set where I do just that in order to track down the rows that I wish to change, and then navigate back to the original table to change those values. Maybe something like this would work for your situation?
Hi @julian Your video describes the problem I envisioned perfectly. I was hoping to be able apply fixes within the dynamic filter subset tables but as you said it is not possible.
Nonetheless, a great tool that I will rely on frequently.
Thanks a lot
Sebastien
Hi Sebastien,
I'm glad I fully understood the challenge you are facing! It's an interesting one and the more I have thought on it, the more ways I can imagine it being useful to have a way to do it through a summary or subset table. I'll absolutely be keeping it in mind in case something changes that would make it possible.
Julian
What version of JMP is this add in compatible with?
@xxvvcczz The code seems to be using For Each, so at minimum JMP16 is required (also same based on addin.def file minJmpVersion=16).
@julian Just getting started with this add-in but it seems like a great addition to JMP. Couple of suggestions came to my mind which might be worth considering for some future release(s):
- Add information to Menu item, that this is an add-in. Might prevent confusion in the future when someone is wondering where my Dynamic Subset menu item is (I have done this for example for Order Selected Columns as I add it to Columns menu)
- Enable toolbars for the window. Even better would be, if you could force the toolbars be same as are used for data tables, but I'm not sure if that is even possible (maybe a wish list item). This would make it very quick to launch user's favorite analyses directly from filtered data table (faster than looking for them in menus).
- If it were to fit nicely somewhere, add count of how many rows original table has.
Some "issues" I did notice:
- If I were to resize my dynamic table and then filter -> my table will sometimes return to original size. Most likely this is triggered when the old box is deleted and new added. (Using JMP16 on Windows 10).
- Comparison for initialized selectedColumns isn't working as expected due to IsEmpty({}) is 0 not 1. N Items() > 0 should work.
- When creating new subset with filtered data, I think it might be better to avoid using << Select Rows(rowsSelected) and then subset with selected rows as this will cause "unnecessary" selections to original table (this will cause some slowdown). Instead subsetting could be done by using Rows(selectedRows). This might also allow you to remove some << Clear Selects.
I also think it might be possible to do what @Sburel is suggesting (if I understood it correctly) but it would require quite a bit of scripting and some of the current code would most likely require rewriting. My suggestions would be to add few controls (this solution could quite easily cause some confusion though):
- Check box/radio box which would allow user to use Summary instead of direct Subset of table. The Summary table would be based on the selected filter columns. This could also be "hidden" in outline box, but I think it would be better to show user which option is being currently used.
- When user finds a value he/she wants to modify, value could be selected. This will also select the same row in original table (and we know column from dynamic subset << Get Selected Columns). Then user could press a button which would open a window which would allow user to change the value.
- After value has been changed rerun dynamic subset to get it updated
Thank you for all this feedback, @jthi! Outstanding suggestions. When I can make time to work on a next iteration I'll certainly try to incorporate some of these.
@julian Not sure if you are aware of it, but this addin does not seem to work in the context of a project.
Hi @Sburel,
Thanks for letting me know! I looked into this and, at least on the Mac, I can confirm that the data table won't appear until you make some kind of selection on a filter. Once you do, it seems like things work as expected. Does that work for you? I'm not sure yet why this is happening but will need to look into it when working on a next version.
Ah, yes, I think I might have an idea what's going on. When I get a moment I'll spin up my virtual machine and see if I can get that working in a project on Windows. I also see even on the Mac things aren't working perfectly, as the outline box for the data filter is gone. Thanks for letting me know about the defect!
Hey @julian ,
I was trying to use the add in to show what my selected rows were by adding in a row state column in the main data table and then using it as the filter for the subset table but for some reason the subset table will clear the selection of the main table and then all the rows show back up on the subset table.
Here are the row state columns I added:
and here is the subset table
Here is a video of the issue
Any ideas on what could be causing the issue and possible fixes?
My current work around is using the subset table window and clicking the auto-refresh button but this has some limitations.
Thanks for any input!
Hi @julian , as a suggestion -- could you please change
to
The combination with a column with formula Selected() will make the Dynamic Subset even more dynamic:
[just works smoothly with JMP 19++ - with the new option :folded_hands: Column Property: Inclusive Values
for JMP <19, selecting nothing will destroy the functionality]
@hogi very clever, I like this very much! That jsl change is straightforward enough, but leads to some unpredictable selection behavior, especially on Mac, where selection precedence ends up fighting amongst the tables. I'll see if I can square that for the Add-In and make the update, but that was one reason it was built that way.
But, in much better news, JMP19 EA3 coming very soon will add dynamic subset as a core feature and you can do exactly what you're doing once you've made that selection column. I look forward to you trying all of this out with the 'real' version!
great!
: )
Recommended Articles
- © 2025 JMP Statistical Discovery LLC. All Rights Reserved.
- Terms of Use
- Privacy Statement
- Contact Us


