- Learn how to build custom Python data connectors and further customize JMP’s Data Connector Framework with the Python Data Connector Demo, available now in the JMP Marketplace!
- See how to create experiments to support product design and ID useful product features. Register for June 12 webinar, 2pm US Eastern Time.
- Subscribe to RSS Feed
- Mark Topic as New
- Mark Topic as Read
- Float this Topic for Current User
- Bookmark
- Subscribe
- Mute
- Printer Friendly Page
Discussions
Solve problems, and share tips and tricks with other JMP users.- JMP User Community
- :
- Discussions
- :
- "Blue Line" Significance Test in Effect Estimates in Fit Model

- Mark as New
- Bookmark
- Subscribe
- Mute
- Subscribe to RSS Feed
- Get Direct Link
- Report Inappropriate Content
"Blue Line" Significance Test in Effect Estimates in Fit Model
Can anyone explain why blue line in Effect Estimates in Fit Model which (implicitly) signifies significance is set at P = 0.01 rather than P= 0.05. Is this alterable in preferences?
Thanks for any advice/guidance/Logic
Accepted Solutions

- Mark as New
- Bookmark
- Subscribe
- Mute
- Subscribe to RSS Feed
- Get Direct Link
- Report Inappropriate Content
Re: "Blue Line" Significance Test in Effect Estimates in Fit Model
This is just my personal interpretation.
The table is showing p-values but also LogWorth values. Personally I would use these in difference scenarios:-
If I'm doing traditional statistical modelling (lets say modelling DOE data) then I would be interested in p-values. Then I would expect the blue line to be to 0.05 threshold. I would also want the table to use p-value formatting (i.e. colour coded p-values) - something it doesn't do.
If I'm dealing with much larger volumes of data and doing predictive modelling then I kind of expect everything to be statistically significant, so LogWorth is more helpful to me in terms of ranking variables. Then a LogWorth threshold is useful to me, maybe 2 or 3 or whatever helps me apply some form of Pareto principle. In this context, the blue line make sense, giving me a threshold of 2 for LogWorth.
So this is what I would like to see:
An option to format the effect summary either in terms of p-value or LogWorth. In p-value format, I want to see the p-value formatting and a thresold line of 0.05. In LogWorth format I don't really want to see p-values. Just show me LogWorth values and the threshold line. Happy to have it at 2, but give me the choice to change the value.

- Mark as New
- Bookmark
- Subscribe
- Mute
- Subscribe to RSS Feed
- Get Direct Link
- Report Inappropriate Content
Re: "Blue Line" Significance Test in Effect Estimates in Fit Model
I'm not sure which "Blue Line" you're talking about. Do you mean the one in the Sorted Parameter Estimates report?

I believe those vertical blue lines are set at the .05 significance level.
If that's not the part of the report you're asking about can you post a picture of the lines you're interested in?
- Mark as New
- Bookmark
- Subscribe
- Mute
- Subscribe to RSS Feed
- Get Direct Link
- Report Inappropriate Content
Re: "Blue Line" Significance Test in Effect Estimates in Fit Model
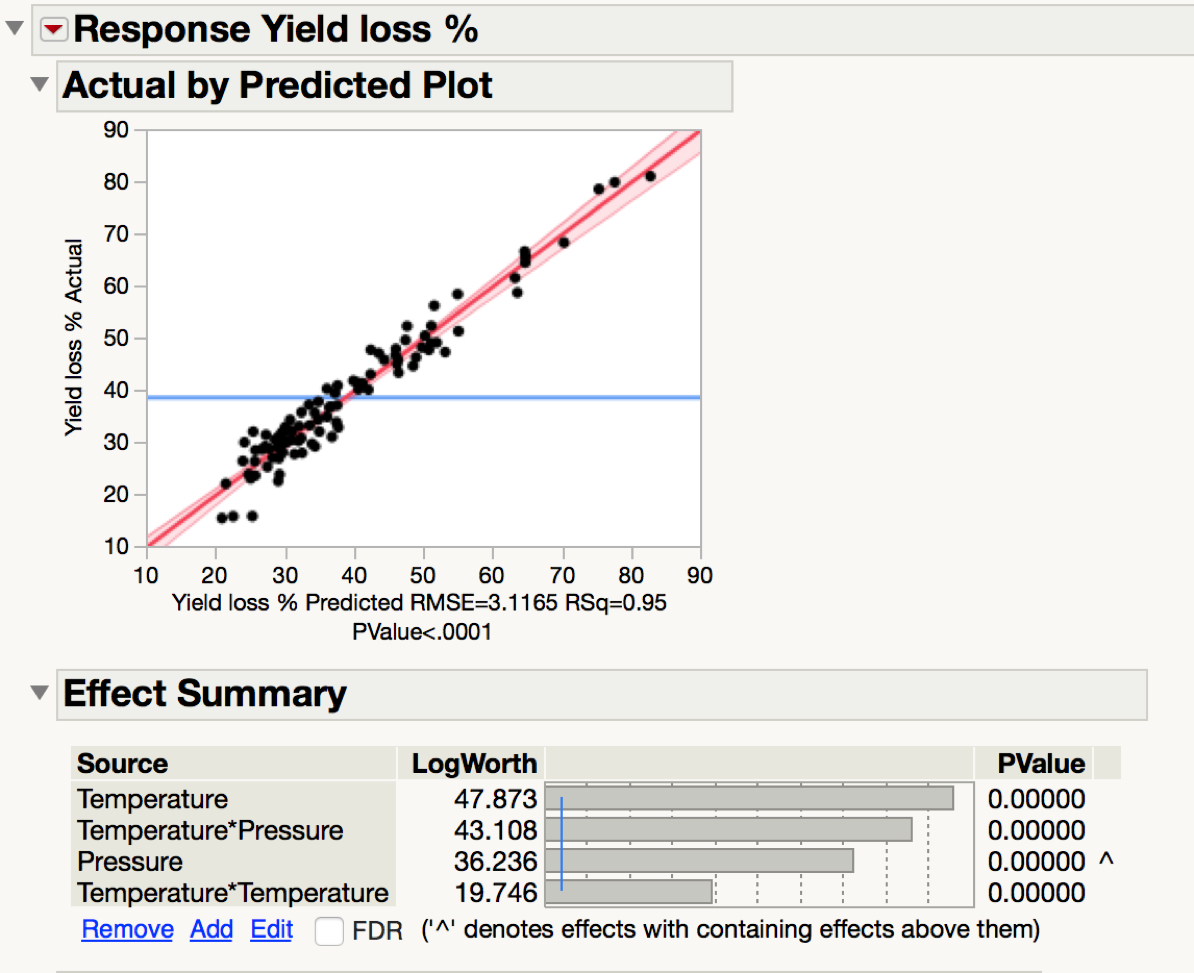
Jeff - it is the blue line in the Effect Summary report in Fit Model which is set at logworth value equivalent to P= 0.01 (I believe)
- Mark as New
- Bookmark
- Subscribe
- Mute
- Subscribe to RSS Feed
- Get Direct Link
- Report Inappropriate Content
Re: "Blue Line" Significance Test in Effect Estimates in Fit Model
This is just my personal interpretation.
The table is showing p-values but also LogWorth values. Personally I would use these in difference scenarios:-
If I'm doing traditional statistical modelling (lets say modelling DOE data) then I would be interested in p-values. Then I would expect the blue line to be to 0.05 threshold. I would also want the table to use p-value formatting (i.e. colour coded p-values) - something it doesn't do.
If I'm dealing with much larger volumes of data and doing predictive modelling then I kind of expect everything to be statistically significant, so LogWorth is more helpful to me in terms of ranking variables. Then a LogWorth threshold is useful to me, maybe 2 or 3 or whatever helps me apply some form of Pareto principle. In this context, the blue line make sense, giving me a threshold of 2 for LogWorth.
So this is what I would like to see:
An option to format the effect summary either in terms of p-value or LogWorth. In p-value format, I want to see the p-value formatting and a thresold line of 0.05. In LogWorth format I don't really want to see p-values. Just show me LogWorth values and the threshold line. Happy to have it at 2, but give me the choice to change the value.
- Mark as New
- Bookmark
- Subscribe
- Mute
- Subscribe to RSS Feed
- Get Direct Link
- Report Inappropriate Content
Re: "Blue Line" Significance Test in Effect Estimates in Fit Model
David - really helpful insight. Thank you. And I agree with your proposed format chnage suggestions!
Recommended Articles
- © 2026 JMP Statistical Discovery LLC. All Rights Reserved.
- Terms of Use
- Privacy Statement
- Contact Us