hi,
I have got an add-in from https://community.jmp.com/t5/JMPer-Cable/Who-what-why-and-how-Tools-for-modeling-and-visualizing/bc-... to implement floodlight analysis through Johnson-Neyman Plot.
according to the table of the example from the linkage above;
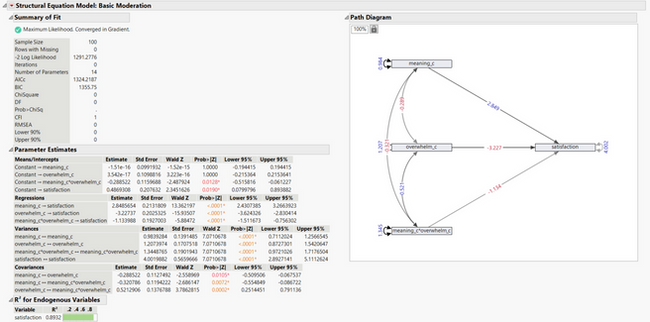
what does "_c" mean? such as "meaning_c" and overwhelming_c"?
focus on my own study, I got a moderator called "SE" which is a continuous variable, and an independent variable which is a categorical variable with 2 levels, i dummied as "0" and "1".
just a quick question about the significant boundary, my output shows that "The simple slope of dummy_c passes from significance to non-significance when average SE_c equals -6.459 and -0.231. The simple slope of dummy_c is significant outside of these two values." why the significant boundary is a negative value (i.e., -6.459 and -0.231). the average SE measured through 11-bipolar scales is generally positive value. moreover, what does "_c" in "average SE_c" or "dummy_c" mean ?
best wishes, Rongyu