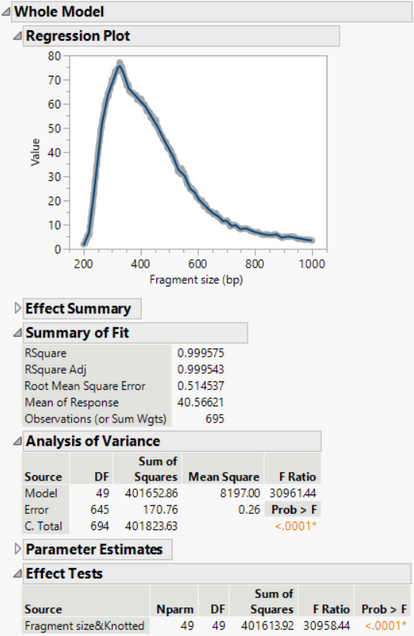
I use this example to illustrate one approach. I follow the instructions up to step 7. Then from the red triangle menu of the report, I choose "Save Columns" > "Prediction Formula". Now I get a new column, and the formula is the function of the curve. Copy the formula from the column.
Now go to Scripting Index, and find "Integrate" function.
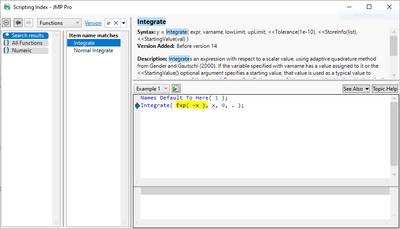
Now paste the formula and replace the highlighted part, get this:
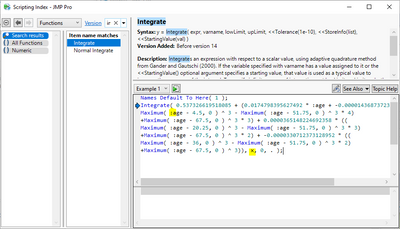
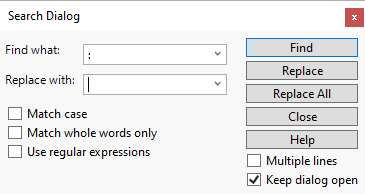
Now remove all the colon symbols, by replacing colon by empty string.
Also replace "x" by "age", my x variable name.
Now decide where the upper limit of the integration (100%), say 80. And the result is 69.783 for 100%.
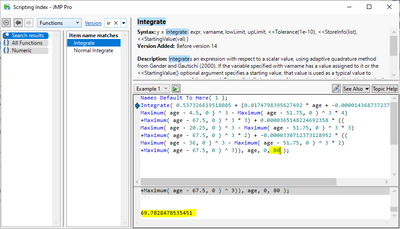
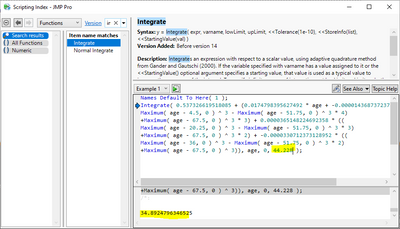
Now the task is to find a number to replace 80, and give me 50%: 69.783/2=34.8915. I got 44.228 after maybe a dozen try and error.
It requires JSL programming, but not much, to get more precise result quickly. Mostly still copy and paste. See the following screenshot.
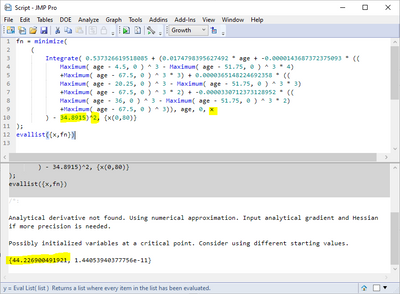
The key is to find the value that minimize the squared difference between integral and the target value 34.8919. So I wrap the difference between integral and the target inside of a square, then call minimize function. Check out the function documentation for the syntax. The result for 50% is 44.226900491921.