- Subscribe to RSS Feed
- Mark Topic as New
- Mark Topic as Read
- Float this Topic for Current User
- Bookmark
- Subscribe
- Mute
- Printer Friendly Page
Discussions
Solve problems, and share tips and tricks with other JMP users.- JMP User Community
- :
- Discussions
- :
- Why is getting values from col list variable not working in labeling the y axis?
- Mark as New
- Bookmark
- Subscribe
- Mute
- Subscribe to RSS Feed
- Get Direct Link
- Report Inappropriate Content
Why is getting values from col list variable not working in labeling the y axis?
I am experimenting with creating a dialog model box that is more user-friendly for my clients. Instead of using radio boxes or check boxes, I am using col list boxes to make the user interface more like the dialog box from the fit model. This script is supposed to customize the graphs and output to save the user time when producing output from a data table JSL script for a given product’s PQAs.
Attached is a JMP file with a toy dataset with basic column names, and attached JSL scripts that I reference throughout this article.
I have a variable that the user inputs a col into called set_resultcol. This value of the set_resultcol can be used with any dataset column header (i.e. a dataset can have “result” or “Result” or “Result (N)” or “Value” as the header of the continuous numeric variable that will be model on the y-axis as the dependent variable.
However, I am running into some issues with the expression of the set_resultcol value not being expressed in the renaming of the y-axis script in the col list box option I have been using to make the user interface more user friendly, even though I have tried getting the values from the col list box resulting list with, for example {“Result”}[1]. I am still new to the concept of col list boxes in the modal window, so I hope that I can get some more experienced eyes on my JSL code to help me determine what can be done.
When I used radio boxes, the resulting value for set_resultcol was a string, which could be referenced in the below JSL for renaming the y-axis to the PQA (quality attribute):
Names Default To Here( 1 );
dt = Current Data Table();

//part 1. ask user for column names in a new window nw1
//possible Group column name (should be character)
character_col_names = dt << Get Column names(character, String);
//possible result column name (should be numeric)
numeric_col_names = dt << Get Column names(Numeric, String);

nw1 = New Window("Set group by variable an",
	<<Modal,
	Text Box ("select the column with the grouping value in it (i.e. mfg group, process, or lot number/batch"),
	groupby_col = Radio Box(character_col_names),
	Text Box ("select the column with the results"),
	result_col = Radio Box(numeric_col_names),
	Text Box ("select the column with the time"),
	time_col = Radio Box(numeric_col_names),
	Text Box ("select the column with the Quality Attribute"),
	pqa_col = Radio Box(character_col_names),
	//Text Box ("Note that it is assumed that the Product Quality Attribute column is named 'PQA'"),
	H List Box(
		Button Box("OK",
		answers = Eval List(
		{
			set_groupby = groupby_col << get selected,
			set_resultcol = result_col << get selected,
			set_time_col = time_col << get selected,
			set_pqa_col = pqa_col << get selected
		}
		);
	nw1 << close window;
		),
	Button Box("Cancel")
		),
	//change popup window size
	<<Size Window(500,700)
);

// If cancel or red X was clicked, stop the script
If( nw1 == {Button( -1 )}, Stop() );

Fit Model(
//…model fitting options
SendToByGroup(
		{Column(dt, set_pqa_col) == "A"},
		SendToReport(
			… //other Dispatch
			Dispatch(
				{},
				set_resultcol, //this needs to be a string, like “Result”
				TextEditBox,
				{Set Text( "A" )}
			),
			… //other Dispatch
		)
)
And the resulting graph would have y-axis label “Result” (for example) renamed “A” (the PQA is called “A” for the sake of simplicity).
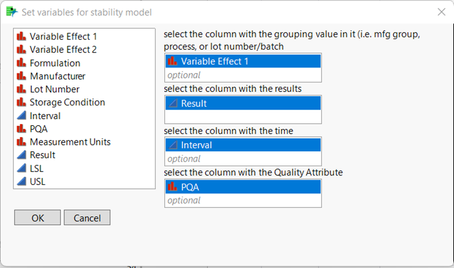
I have the following modal dialog box I have created with the col list box to make the modal dialog more user friendly and aesthetic with a drag and drop feature instead of having all the columns displayed at once. Below this window I have the corresponding JSL code that I am having trouble with regarding these col list boxes.
Names Default To Here( 1 );
dt = Current Data Table();

nw1 = New Window("Set variables for stability model",
	<<Modal,

	//Data Filter Context Box(),
	H List Box(
		chooseme = Col List Box(dt, all), //for column selection click and drag box,
		Text Box ("   "),
		V List Box(
			Text Box ("select the column with the grouping value in it (i.e. mfg group, process, or lot number/batch"),
			groupby_col = Col List Box( width( 200 ), nlines( 2 ) ), //Radio Box(character_col_names),
			Text Box ("select the column with the results"),
			result_col = Col List Box( numeric, width( 200 ),  nlines( 2 ), max items (1) ), //Radio Box(numeric_col_names),
			Text Box ("select the column with the time"),
			time_col = Col List Box( width( 200 ), nlines( 2 ) ), //Radio Box(numeric_col_names),
			Text Box ("select the column with the Quality Attribute"),
			pqa_col = Col List Box( width( 200 ), nlines( 2 ) ) //Radio Box(character_col_names)
		)
	),
	//Text Box ("Note that it is assumed that the Product Quality Attribute column is named 'PQA'"),
	H List Box(
		Button Box("OK",
		answers = Eval List(
		{
			set_groupby = groupby_col << get selected,
			set_resultcol = result_col << get selected, //get selected << get items,
			set_time_col = time_col << get selected,
			set_pqa_col = pqa_col << get selected
		}
		);
	nw1 << close window;
		),
	Button Box("Cancel")
		),
	//change popup window size
	<<Size Window(600,350)
);

// If cancel or red X was clicked, stop the script
If( nw1 == {Button( -1 )}, Stop() );

Fit Model(
//… fit model options
SendToByGroup(
		{Column(dt, set_pqa_col) == "A"},
		SendToReport(
			Dispatch(
				//…other Dispatch and Fit model options
//should be "Result" for example, if the result column is named "Result"
				set_resultcol, //I have also tried:
								//set_resultcol[1],
								//Eval(set_resultcol[1]),
//Get column name(column(dt, set_resutlcol))
				TextEditBox,
				{Set Text( "A" )}
			),
	//…other Dispatch and Fit model options
)
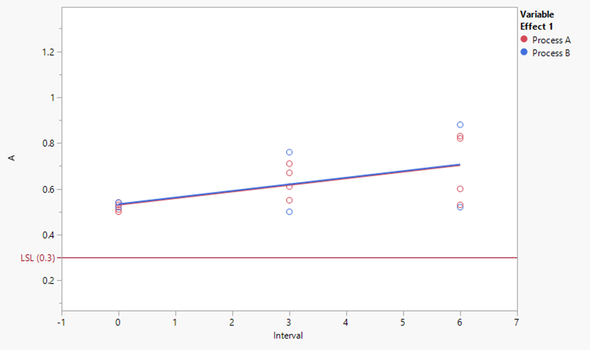
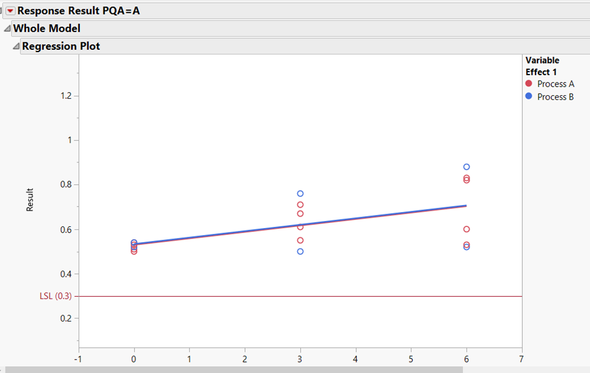
However, the resulting graph is as follows, with the y-axis name, in this data table “Result” on the y-axis, when it should say "A” for the PQA “A”:
I know that the col list box is producing lists of variables, because I have options in the JSL script that tell me:
//is this set_resultcol a list? if so, show the contents.
Show(is list(set_resultcol)); // which gives 1 or “true” as shown in the log
Show(set_resultcol[1]); //which gives “Result” as shown in the log
What is wrong with this JSL script that is not allowing this to be referenced in the dataset? What can I do to fix this?
The only documentation I can find relating to this issue is in the “JMP 15 Scripting Guide” pdf pages 524, 527-529 for the col list boxes, and the section on lists in that manual. I have tried this examples, but they are not telling me anything that I don’t already know.
Accepted Solutions
- Mark as New
- Bookmark
- Subscribe
- Mute
- Subscribe to RSS Feed
- Get Direct Link
- Report Inappropriate Content
Re: Why is getting values from col list variable not working in labeling the y axis?
I wouldn't use Dispatch to modify reports if I can avoid it. I would rather get the references and then modify report based on those. Script below might give you some ideas:
Names Default To Here(1);
dt = Open("$DOWNLOADS/Col List Box Y-axis labeling issue 7_11_2022.jmp");

nw1 = New Window("Set variables for stability model",
	<<Modal,
	<<Return result,
	H List Box(
		chooseme = Col List Box(dt, all),
		Text Box("   "),
		V List Box(
			Text Box("select the column with the grouping value in it (i.e. mfg group, process, or lot number/batch"),
			groupby_col = Col List Box(width(200), nlines(2), << Append({"Variable Effect 1"})),
			Text Box("select the column with the results"),
			result_col = Col List Box(numeric, width(200), nlines(2), max items(1), << Append({"Result"})),
			Text Box("select the column with the time"),
			time_col = Col List Box(width(200), nlines(2), << Append({"Interval"})),
			Text Box("select the column with the Quality Attribute"),
			pqa_col = Col List Box(width(200), nlines(2), << Append({"PQA"})),
		)
	),
	H List Box(
		Button Box("OK",
			answers = Eval List(
				{set_groupby = groupby_col << get items, set_resultcol = result_col << get items,
				set_time_col = time_col << get items, set_pqa_col = pqa_col << get items}
			);
		),
		Button Box("Cancel")
	),
	<<Size Window(600, 350)
);


If(nw1["Button"] != 1, Stop());

show(set_groupby, set_resultcol, set_time_col, set_pqa_col);

Eval(EvalExpr(fm = dt << Fit Model(
	Y(Column(Expr(set_resultcol))),
	By(Column(Expr(set_pqa_col))),
	Effects(Column(Expr(set_groupby)), Column(Expr(set_time_col))),
	Personality("Standard Least Squares"),
	Emphasis("Effect Leverage"),
	Run(
		Column(dt, set_resultcol) << {Summary of Fit(1), Analysis of Variance(1), Parameter Estimates(1), Scaled Estimates(0),
		Plot Actual by Predicted(1), Plot Residual by Predicted(1), Plot Studentized Residuals(0), Plot Effect Leverage(1),
		Plot Residual by Normal Quantiles(0), Box Cox Y Transformation(0)}
	)
)));

// Format axis by not hard coding dispatch, for this we need some settings to make it easier and not as hard-coded
aa_settings = [ // could be retrieved from LSL and USL columns
	"A" =>
		["LSL" => 0.3, "USL" => 0.9],
	"B" =>
		["LSL" => 0.5, "USL" => 2],
	"C" =>
		["LSL" => 4, "USL" => 6]
];

//Response Result outline box references
response_ob_refs = fm << XPath("//OutlineBox[contains(text(), 'Response Result PQA')]");

For Each({ror_list}, response_ob_refs,
	ror = ror_list[1];
	cur_group = Word(2, ror << get title, "=");
	cur_lsl = aa_settings[cur_group]["LSL"];
	cur_usl = aa_settings[cur_group]["USL"];
	rp_ref = (ror << XPath("//OutlineBox[contains(text(), 'Regression Plot')]"))[1];

	// Y-axis
	y_axis = rp_ref[Axis Box(1)];
	Eval(EvalExpr(
		y_axis << Add Ref Line(Expr(cur_lsl), "Solid", Dark Red, Expr(EvalInsert("LSL (^cur_lsl^)")), 1);
		y_axis << Add Ref Line(Expr(cur_usl), "Solid", Dark Red, Expr(EvalInsert("USL (^cur_usl^)")), 1);
	));
	y_axis << RemoveAxisLabel("Result");
	y_axis << AddAxisLabel(cur_group);
	y_axis << Min(cur_lsl);
	y_axis << Max(cur_usl);

	f_box = rp_ref[FrameBox(1)];
	f_box << Frame Size(600, 400);

	// Legend
	f_box << Row Legend(
		Eval(set_groupby),
		Color(1),
		Color Theme("JMP Default"),
		Marker(0),
		Marker Theme(""),
		Continuous Scale(0),
		Reverse Scale(0),
		Excluded Rows(0)
	);
);
If you for some reason really want to use Dispatch then I suggest checking out Insert one expression into another using Eval Insert, Eval Expr, Parse, and Substitute
Recommended Articles
- © 2026 JMP Statistical Discovery LLC. All Rights Reserved.
- Terms of Use
- Privacy Statement
- Contact Us


