- New to JMP? Join us Sept. 23-24 for the Early User Edition of Discovery Summit, tailor-made for new users. Register now for free!
- Use World Cup data to build models, explore spatial relationships, and create informative visualizations in JMP. Register. July 17, 2 pm US Eastern Time.
- Your voice matters! Tell us how you prefer to receive JMP updates, so we can tailor our communication to your needs. Take short survey.
- Subscribe to RSS Feed
- Mark Topic as New
- Mark Topic as Read
- Float this Topic for Current User
- Bookmark
- Subscribe
- Mute
- Printer Friendly Page
Discussions
Solve problems, and share tips and tricks with other JMP users.- JMP User Community
- :
- Discussions
- :
- Using a radio box to select axis variable in dashboard

- Mark as New
- Bookmark
- Subscribe
- Mute
- Subscribe to RSS Feed
- Get Direct Link
- Report Inappropriate Content
Using a radio box to select axis variable in dashboard
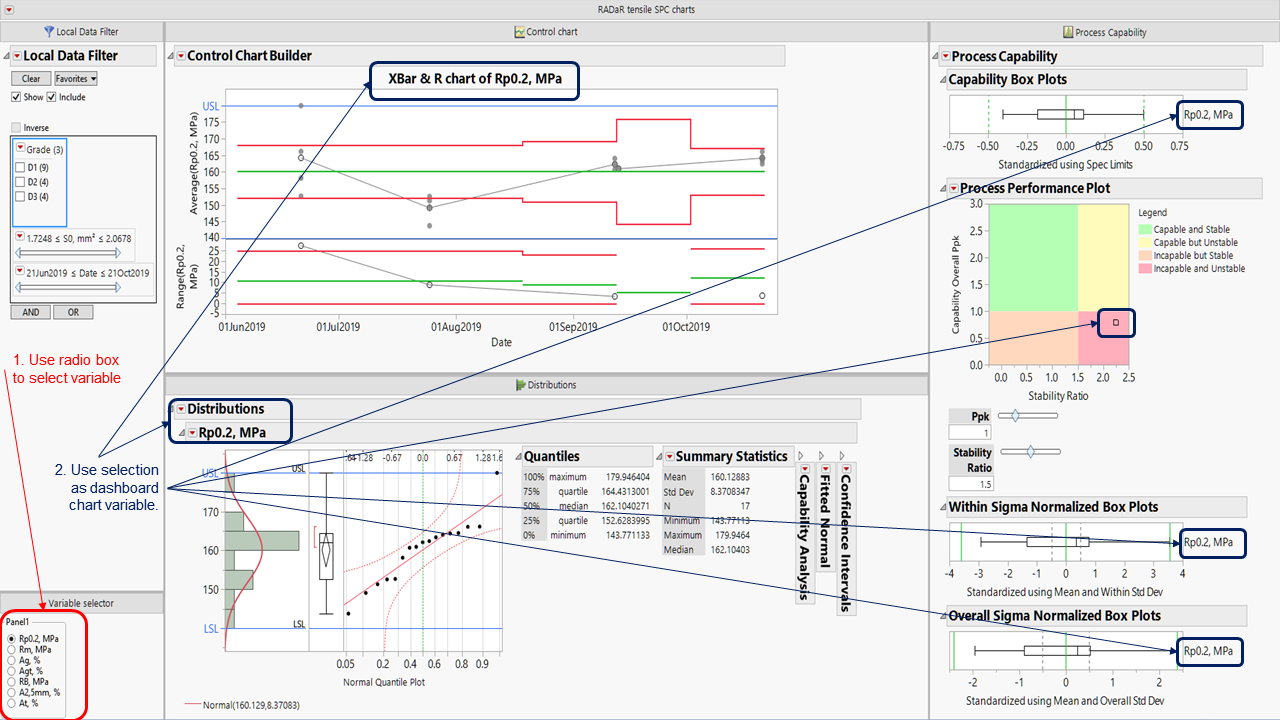
I have created a dashboard for checking the capability of a tensile machine containing a local filter, control chart, distribution and process capability plots, see image. I have also included a radio box with a list of chartable columns (ColList) so to allow the user to interactively chose the response to be charted:
Panel1 = Panel Box( "Column selector",
		    rb = Radio Box( ColList , width( 200 ),
		    1, show( rb << Get() )
		 )
);
SelectVar = rb << get selected;
What I want to do is get the value (SelectVar) from the radio box and use it as a variable in the other graphs. I can see how this is done using a column switcher, but I don't know how to do it using a local variable.
I've added the jmp data file and the dashboard script files.
Accepted Solutions

- Mark as New
- Bookmark
- Subscribe
- Mute
- Subscribe to RSS Feed
- Get Direct Link
- Report Inappropriate Content
Re: Using a radio box to select axis variable in dashboard
Hi again,
I amended the code to include the Distribution object as well. Please take a look and let me know if it helps.
- Mark as New
- Bookmark
- Subscribe
- Mute
- Subscribe to RSS Feed
- Get Direct Link
- Report Inappropriate Content
Re: Using a radio box to select axis variable in dashboard
Hi,
I think I've made some progress towards a possible solution. Take a look at this section of code:
	Panel1 = Panel Box( "Column selector",
									rb = Radio Box( ColList , width( 200 ), 1, cb1<<delete; Report1<<append(cb1=cbfunction(Column(rb << get selected )));
													)
				);
				Splitter2 = V Splitter Box();
				TabPage1 = Tab Page Box();
				Scroll1 = Scroll Box();
				Report1 = Platform(
					DataTable1,
					cb1=Control Chart Builder(
						Size( 918, 368 ),
						Show Control Panel( 0 ),
						Show Excluded Region( 0 ),
						Show Limit Summaries( 0 ),
						Show Capability( 0 ),
						Variables( Subgroup( :Date ), Y(Column(rb << get selected )) ),
The Control Chart Builder object is called cb1. The radiobox script deletes cb1, and then appends what is returned by the function cbfuntion. The script defining that function is below:
cbfunction=Function({col},
	cb=Control Chart Builder(
						Size( 918, 368 ),
						Show Control Panel( 0 ),
						Show Excluded Region( 0 ),
						Show Limit Summaries( 0 ),
						Show Capability( 0 ),
						Variables( Subgroup( :Date ), Y(col) ),
						Chart(
							Position( 1 ),
							Points( Individual Points( 1 ) ),
							Limits
						),
						Chart( Position( 2 ) ),
						SendToReport(
							Dispatch(
								{},
								"Control Chart Builder",
								FrameBox,
								{DispatchSeg(
									Marker Seg( 1 ),
									{Marker( "Circle" )}
								), DispatchSeg(
									Marker Seg( 2 ),
									{Color( {126, 126, 126} ),
									Marker( "FilledCircle" ), Transparency( 0.8 )}
								)}
							),
							Dispatch(
								{},
								"Control Chart Builder",
								FrameBox( 2 ),
								{DispatchSeg(
									Marker Seg( 1 ),
									{Marker( "Circle" )}
								)}
							)
						)
					);

					Return(cb);

);
Let me know if this makes sense and if you can use it to create the required functionality.
- Mark as New
- Bookmark
- Subscribe
- Mute
- Subscribe to RSS Feed
- Get Direct Link
- Report Inappropriate Content
Re: Using a radio box to select axis variable in dashboard
Hi again,
I amended the code to include the Distribution object as well. Please take a look and let me know if it helps.
- Mark as New
- Bookmark
- Subscribe
- Mute
- Subscribe to RSS Feed
- Get Direct Link
- Report Inappropriate Content
Re: Using a radio box to select axis variable in dashboard
Thanks @HadleyMyers;, it works perfectly for the two control charts. The process capability plots don't change with the radio button, but I can work out how to do that from your script. I'll upload the final script to the cookbook once I get it working.
- Mark as New
- Bookmark
- Subscribe
- Mute
- Subscribe to RSS Feed
- Get Direct Link
- Report Inappropriate Content
Re: Using a radio box to select axis variable in dashboard
Perfect. Please don't hesitate to come back if you get stuck or need any help with the Process Capability plots.
Recommended Articles
- © 2026 JMP Statistical Discovery LLC. All Rights Reserved.
- Terms of Use
- Privacy Statement
- Contact Us