Turn on suggestions
Auto-suggest helps you quickly narrow down your search results by suggesting possible matches as you type.
- New to JMP? Join us Sept. 23-24 for the Early User Edition of Discovery Summit, tailor-made for new users. Register now for free!
Options
- Subscribe to RSS Feed
- Mark Topic as New
- Mark Topic as Read
- Float this Topic for Current User
- Bookmark
- Subscribe
- Mute
- Printer Friendly Page
Discussions
Solve problems, and share tips and tricks with other JMP users.- JMP User Community
- :
- Discussions
- :
- The y-axis scale is not changing

Level I
- Mark as New
- Bookmark
- Subscribe
- Mute
- Subscribe to RSS Feed
- Get Direct Link
- Report Inappropriate Content
The y-axis scale is not changing
Mar 25, 2025 01:33 PM
(2138 views)
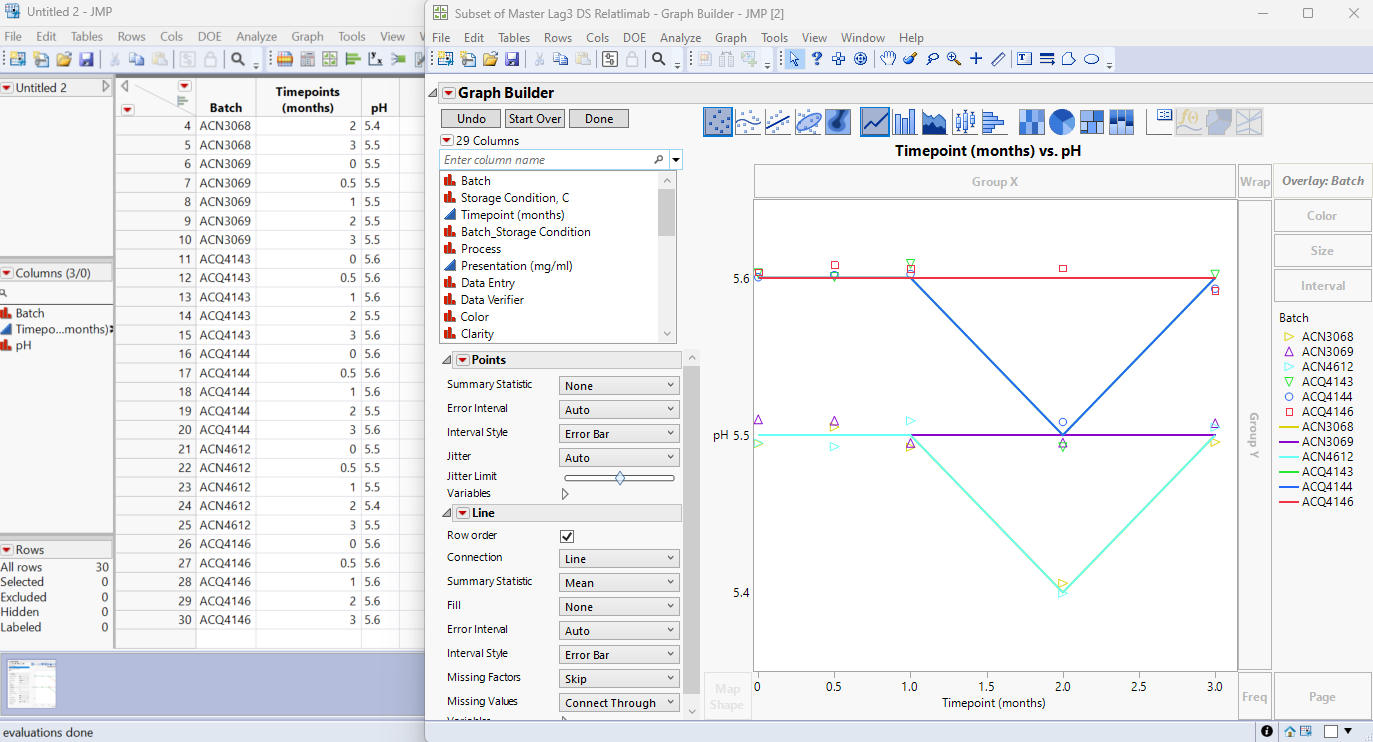
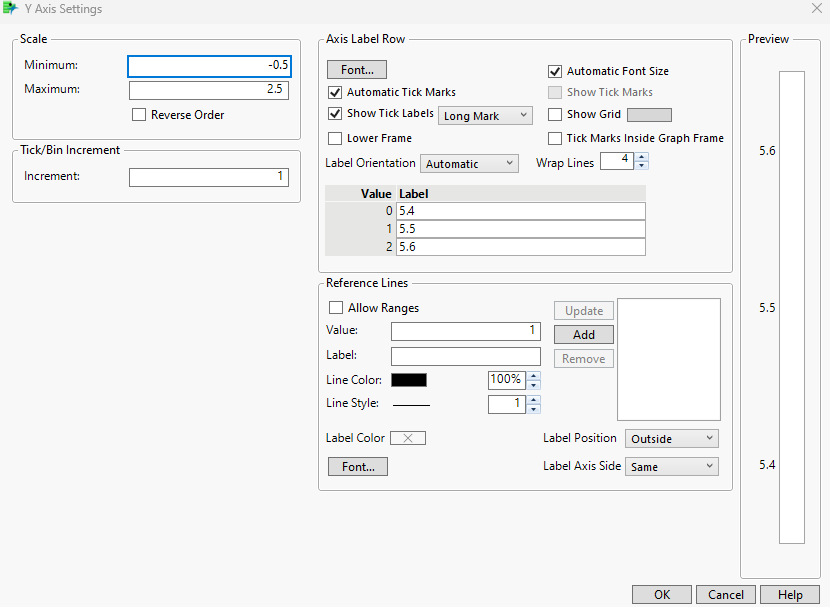
Hello! I am working on JMP 17 and trying to graph this data set, with the timepoints (months) on the x-axis and the pH results on the y-axis. I did the overlay as "batch". I was able to graph it, however, when I try to edit the y-axis to make the scale from 5-6 and increments of 0.5, nothing happens. I am assuming it has to be with the value and label thing, but how do I make it so its standard scale 5-6 on y-axis?
1 ACCEPTED SOLUTION
Accepted Solutions

Super User
Solution
- Mark as New
- Bookmark
- Subscribe
- Mute
- Subscribe to RSS Feed
- Get Direct Link
- Report Inappropriate Content
Re: The y-axis scale is not changing
Change the pH column to numeric and it will work. Double click on the pH column header and change character to numeric/continuous:
Old:

New:

2 REPLIES 2
Super User
Solution
- Mark as New
- Bookmark
- Subscribe
- Mute
- Subscribe to RSS Feed
- Get Direct Link
- Report Inappropriate Content
Re: The y-axis scale is not changing
Change the pH column to numeric and it will work. Double click on the pH column header and change character to numeric/continuous:
Old:
New:
Level I
- Mark as New
- Bookmark
- Subscribe
- Mute
- Subscribe to RSS Feed
- Get Direct Link
- Report Inappropriate Content
Re: The y-axis scale is not changing
It worked, thank you very much!
Recommended Articles
- © 2026 JMP Statistical Discovery LLC. All Rights Reserved.
- Terms of Use
- Privacy Statement
- Contact Us