- JMP will suspend normal business operations for our Winter Holiday beginning on Wednesday, Dec. 24, 2025, at 5:00 p.m. ET (2:00 p.m. ET for JMP Accounts Receivable).
Regular business hours will resume at 9:00 a.m. EST on Friday, Jan. 2, 2026. - We’re retiring the File Exchange at the end of this year. The JMP Marketplace is now your destination for add-ins and extensions.
- Subscribe to RSS Feed
- Mark Topic as New
- Mark Topic as Read
- Float this Topic for Current User
- Bookmark
- Subscribe
- Mute
- Printer Friendly Page
Discussions
Solve problems, and share tips and tricks with other JMP users.- JMP User Community
- :
- Discussions
- :
- Re: Strange 5 parameter logistic regression results

- Mark as New
- Bookmark
- Subscribe
- Mute
- Subscribe to RSS Feed
- Get Direct Link
- Report Inappropriate Content
Strange 5 parameter logistic regression results
Hello,
I have a large amount of Luminex data, using a 48plex panel, where each of the 48 analytes it detects in samples is calculated against a standard curve (so 48 standard curves total). Each column in my dataset is a different analyte. Each row corresponds to either a standard (in a 1:4 dilution series) or an unknown sample. I have been using the following function to fit the data using a 5 parameter logistic regression, 48 times in series:
Fit Curve(Y( :"[ANALYTE NAME]"n ),X( [DILUTION FACTOR]),Fit Logistic 5P(Save inverse prediction Formula),SendToReport(Dispatch( {}, "Logistic 5P", OutlineBox, {Set Title( "Logistic 5P" )} )));:"Dil Predictor" << Set Name("[ANALYTE NAME]")
Note that I know very little about how to use JMP and copied this from code editor thing after someone showed me how to fit the data once. In order to run this, I have to hide/exclude all of the rows containing values for my unknown samples, and only include/unhide rows with data about standards.
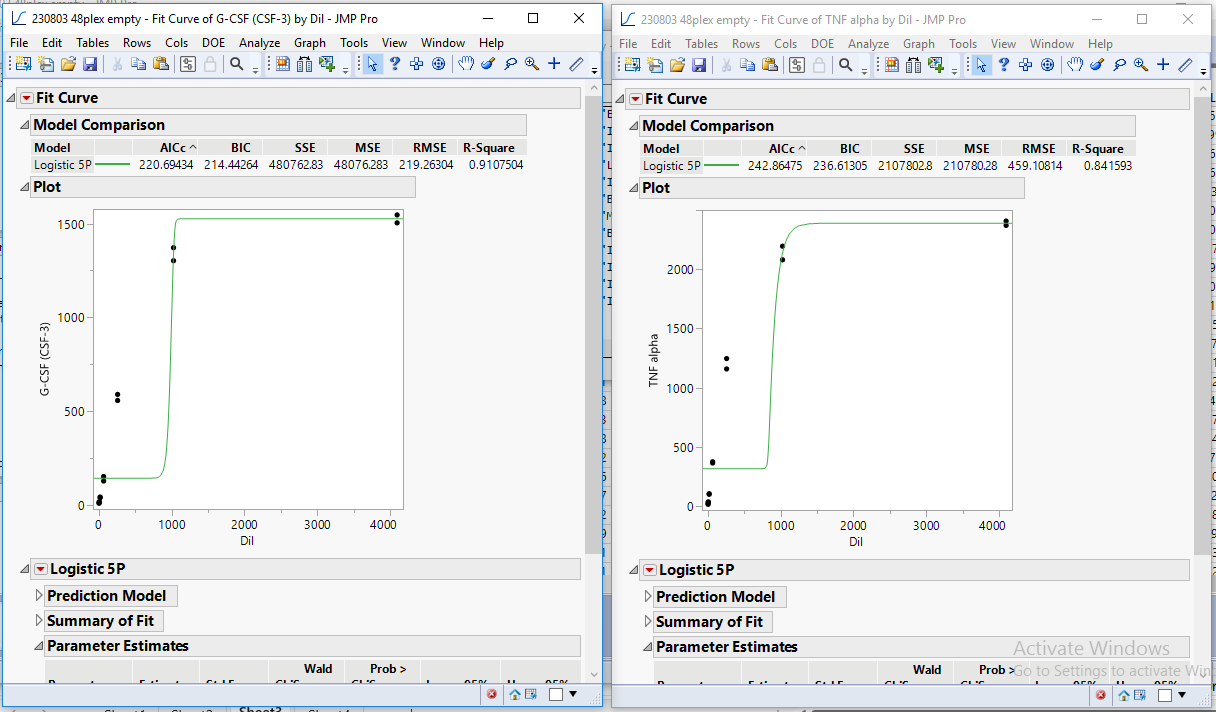
Generally, I get curves with an r2 > 0.99 that appear to fit pretty well with the measured standard points in the graphs, but sparingly, I get very strange curves (see image). I'm no expert at curve fitting, but it looks like a better curve could be fit through those points. Are there parameters about how JMP fits 5 parameter logistic regressions that I can adjust in order to avoid these junk curves?
Thanks
- Tags:
- windows

- Mark as New
- Bookmark
- Subscribe
- Mute
- Subscribe to RSS Feed
- Get Direct Link
- Report Inappropriate Content
Re: Strange 5 parameter logistic regression results
Hi,
It looks like you forgot to transform your X axis into LOG. The 5-parameter fit tries its best, but you can see the major lack of fit for the low and intermediate values.
Best,
TS
- Mark as New
- Bookmark
- Subscribe
- Mute
- Subscribe to RSS Feed
- Get Direct Link
- Report Inappropriate Content
Re: Strange 5 parameter logistic regression results
Hello, thank you for the response! Adjusting the view of the x-axis leaves everything looking like a botched fit to me (see image).

- Mark as New
- Bookmark
- Subscribe
- Mute
- Subscribe to RSS Feed
- Get Direct Link
- Report Inappropriate Content
Re: Strange 5 parameter logistic regression results
I would not expect to fit a logistic curve model with 5 parameters when the data does not exhibit such complexity. For example, I expect the data to exhibit both asymptotes in order to fit a logistic curve with a 4-parameter model.
Nonlinear models such as this have high correlations among the parameter estimates, so they can be unstable in the first place, even when the data exhibit all the features of the expected shape.
- Mark as New
- Bookmark
- Subscribe
- Mute
- Subscribe to RSS Feed
- Get Direct Link
- Report Inappropriate Content
Re: Strange 5 parameter logistic regression results
Welcome!
Please read the chapter for the Fit Curve platform in the JMP documentation. It has many features specifically to help analyze assay dilution curves.
You do not need a script. Your data table is tall, so instead of hiding and excluding rows, you can use an identifier data column in the By role for parallel processing of all pairs of curves.
- Mark as New
- Bookmark
- Subscribe
- Mute
- Subscribe to RSS Feed
- Get Direct Link
- Report Inappropriate Content
Re: Strange 5 parameter logistic regression results
Hello, thank you for the response! I've been looking through the documentation but haven't found what I'm looking for yet. The problem isn't related to the script; it's that I'm occasionally getting bad fits and there doesn't seem to be a reason why. As I look through the documentation, I'm looking for some set of parameters that I can modify for a 5PL, since something's not working with this analysis.
- Mark as New
- Bookmark
- Subscribe
- Mute
- Subscribe to RSS Feed
- Get Direct Link
- Report Inappropriate Content
Re: Strange 5 parameter logistic regression results
Given the simple features exhibited in your data, I believe the cause of the bad fits is that your 5PLC is over-parameterized. Try fitting a logistic curve with fewer parameters, say 3 or 4, and see if the fit improves.
Recommended Articles
- © 2025 JMP Statistical Discovery LLC. All Rights Reserved.
- Terms of Use
- Privacy Statement
- Contact Us