- Don’t miss your chance to experience Discovery Summit Europe at our best available rate! Early bird registration through 31 Oct.
- Graph Builder Toolbar streamlines interactive graphing. Creates shortcuts on Report and GraphBuilder Helpers toolbars. Download and install the extension.
- JMP will suspend normal business operations for our Rest and Recharge Day on Friday, October 2, 2026.
Regular business hours will resume on Monday, October 5, 2026.
- Subscribe to RSS Feed
- Mark Topic as New
- Mark Topic as Read
- Float this Topic for Current User
- Bookmark
- Subscribe
- Mute
- Printer Friendly Page
Discussions
Solve problems, and share tips and tricks with other JMP users.- User Community
- :
- Discussions
- :
- Sigma Plot of smoother curves

- Mark as New
- Bookmark
- Subscribe
- Mute
- Subscribe to RSS Feed
- Get Direct Link
- Report Inappropriate Content
Sigma Plot of smoother curves
Hi,
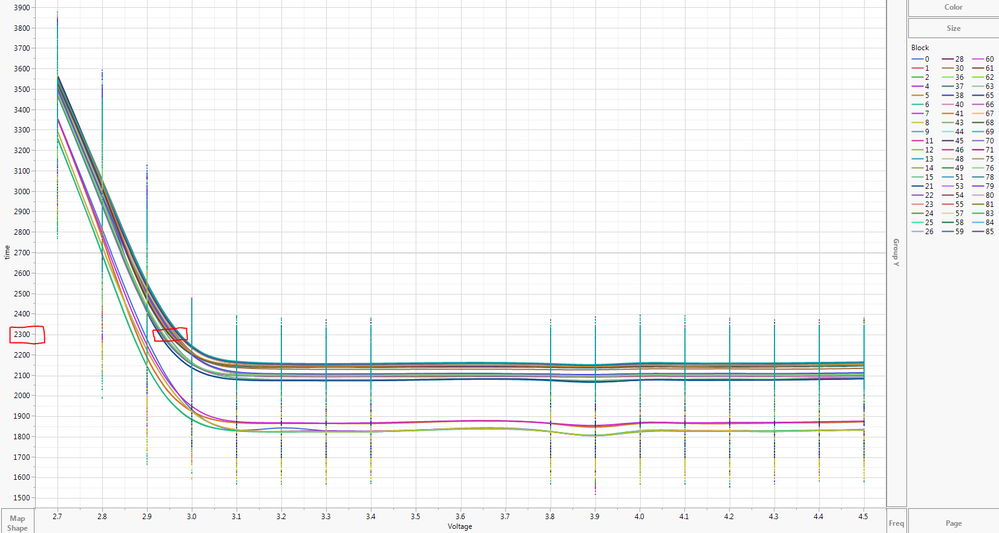
I want a sigma plot of smoother curves at a time value of 2300 for the upper curves (circled in red, It looks like I have a bi-modal distribution so I just want to focus on the biomodal distrubtion that has more data points). I have no voltage measurements at the circled points (values are between 2.9 and 3.0V). Is there a way to get a sigma plot of these smoother plots at a time of 2300?


- Mark as New
- Bookmark
- Subscribe
- Mute
- Subscribe to RSS Feed
- Get Direct Link
- Report Inappropriate Content
Re: Sigma Plot of smoother curves
Why don't you just reverse X and Y in your smoothing splines so don't have to use a solver? That way you should be able to get the predicted values in the same manner I outlined.
- Mark as New
- Bookmark
- Subscribe
- Mute
- Subscribe to RSS Feed
- Get Direct Link
- Report Inappropriate Content
Re: Sigma Plot of smoother curves
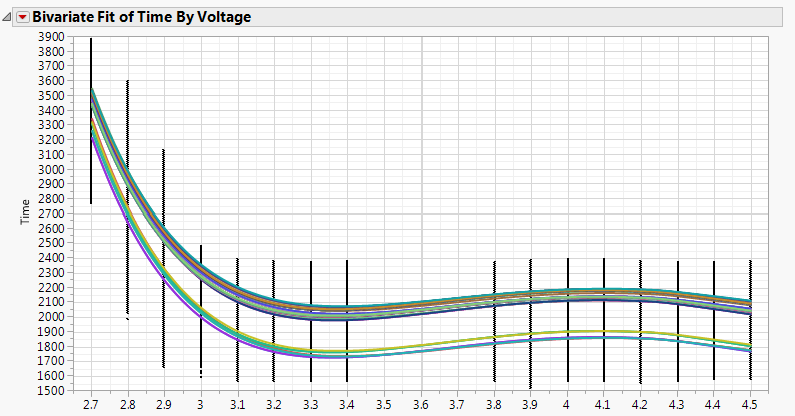
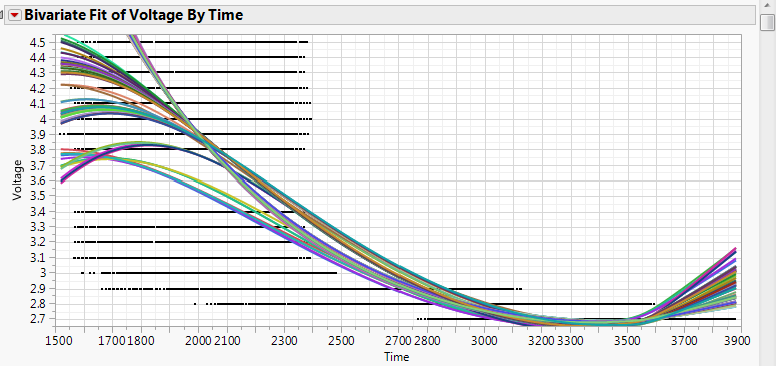
I have tried that but the fit I want is a reciprocal fit which is giving me a bad fit. This is the main reason why I want to use time vs voltage. Additionally, when running the experiement the voltage was set and teh time was measured. So the voltage measurements are discrete. I agree if I could have a voltage vs time fit (bottom graph) it would make my analysis easier. Maybe the fit I am using is wrong when I do a voltage vs time..
- « Previous
-
- 1
- 2
- Next »
Recommended Articles
- © 2026 JMP Statistical Discovery LLC. All Rights Reserved.
- Terms of Use
- Privacy Statement
- Contact Us