- Don’t miss your chance to experience Discovery Summit Europe at our best available rate! Early bird registration through 31 Oct.
- Graph Builder Toolbar streamlines interactive graphing. Creates shortcuts on Report and GraphBuilder Helpers toolbars. Download and install the extension.
- JMP will suspend normal business operations for our Rest and Recharge Day on Friday, October 2, 2026.
Regular business hours will resume on Monday, October 5, 2026.
- Subscribe to RSS Feed
- Mark Topic as New
- Mark Topic as Read
- Float this Topic for Current User
- Bookmark
- Subscribe
- Mute
- Printer Friendly Page
Discussions
Solve problems, and share tips and tricks with other JMP users.- User Community
- :
- Discussions
- :
- Re: Reference a scale box with a variable

- Mark as New
- Bookmark
- Subscribe
- Mute
- Subscribe to RSS Feed
- Get Direct Link
- Report Inappropriate Content
Reference a scale box with a variable
Hi,
I'm trying to produce multiple graphs with a for loop, and assign the column title to the Y axis.
After graphing, I want to add three reference lines to the Y axis with a Dispatch command, but cannot figure out how to dynamically reference the Y axis box, see *** below:
For( i = 12, i <= 18, i++,
	Col_name = Column( i ) << Get Name;
	temp = Expr( Col_name );
//Graph Line Data
	Split_dt << Graph Builder(
		Size( 536, 500 ),
		Variables( X( :Year ), X( :Month, Position( 1 ) ), X( :Day, Position( 1 ) ), Y( Column( i ) ) ),
		Elements(
			Box Plot( X( 1 ), X( 2 ), Y, Legend( 9 ), Jitter( 1 ), Outliers( 1 ), Box Style( "Outlier" ) )
		),
		SendToReport(
			Dispatch(
				{},
				,
				ScaleBox,
				{Add Ref Line( 9, Solid, "Black", "LSL" ), Add Ref Line( 21, Solid, "Black", "USL" ),
				Add Ref Line( 16, Dashed, "Medium Dark Green", "Target" )}
			)
		),
		SendToReport(
			Dispatch(
				{},
				"graph title",
				TextEditBox,
				{Set Text( "Line " || Char( Line_Number ) || " " || Col_name )}
			)
		)
	);
);
This code returns the error "Cannot find ScaleBox[ "Col_name" ] at {}", as if JSL is evaluating Col_name as a string.
Any ideas on for to make Col_name evaluate to it's value, or add the ref lines differently?
Thanks!
- Mark as New
- Bookmark
- Subscribe
- Mute
- Subscribe to RSS Feed
- Get Direct Link
- Report Inappropriate Content
Re: Reference a scale box with a variable
Forgot to add the ***, see below:
For( i = 12, i <= 18, i++,
	Col_name = Column( i ) << Get Name;
	temp = Expr( Col_name );
//Graph Line Data
	Split_dt << Graph Builder(
		Size( 536, 500 ),
		Variables( X( :Year ), X( :Month, Position( 1 ) ), X( :Day, Position( 1 ) ), Y( Column( i ) ) ),
		Elements(
			Box Plot( X( 1 ), X( 2 ), And, Legend( 9 ), Jitter( 1 ), Outliers( 1 ), Box Style( "Outlier" ) )
		),
		SendToReport(
			Dispatch(
				{},

   				ScaleBox,
				{Add Ref Line( 9, Solid, "Black", "LSL" ), Add Ref Line( 21, Solid, "Black", "USL" ),
				Add Ref Line( 16, Dashed, "Medium Dark Green", "Target" )}
			)
		),
		SendToReport(
			Dispatch(
				{},
				"graph title",
				TextEditBox,
				{Set Text( "Line " || Char( Line_Number ) || " " || Col_name )}
			)
		)
	);
);
- Mark as New
- Bookmark
- Subscribe
- Mute
- Subscribe to RSS Feed
- Get Direct Link
- Report Inappropriate Content
Re: Reference a scale box with a variable
I've discovered a work-around by setting spec limits for the columns I want to graph and setting show as reference lines:
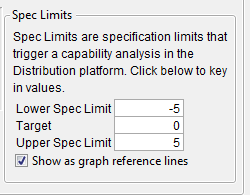
I still don't know of any way to make the Dispatch function evaluate the variable. It just takes it as a string.

- Mark as New
- Bookmark
- Subscribe
- Mute
- Subscribe to RSS Feed
- Get Direct Link
- Report Inappropriate Content
Re: Reference a scale box with a variable
Here's one way to add reference lines to an axis via JSL:
Names Default To Here( 1 );
// Make some data and make a graph
dt = New Table( "Test", New Column( "Y", Numeric, Continuous, Formula( Random Normal() ) ), AddRows( 20 ) );
gb = dt << Graph Builder(
	Size( 528, 420 ),
	Show Control Panel( 0 ),
	Variables( Y( :Y ) ),
	Elements( Points( Y, Legend( 16 ) ) ),

);
// Template expression to add a reference line
addRefLine = Expr(
	gb << SendToReport( Dispatch( {}, "Y", ScaleBox, {Add Ref Line( TBD, "Solid", "Black", "", 1 )} ) )
);
// Loop . . .
For( i = -3, i <= 3, i++,
	Wait( 1 );
	Eval( Substitute( Name Expr( addRefLine ), Expr( TBD ), i ) );
);
Recommended Articles
- © 2026 JMP Statistical Discovery LLC. All Rights Reserved.
- Terms of Use
- Privacy Statement
- Contact Us