cancel
Showing results for 
Show  only  | Search instead for 
Did you mean: 
  • JMP Security Notice: CVE-2026-109618 and CVE-2026-109619

    JMP promptly initiated a review of its products, services, and relevant infrastructure for exposure to CVE-2026-109618 and CVE-2026-109619.

    Our assessment of JMP products has not identified exposure to these vulnerabilities. Where remediation was required within supporting environments, appropriate security updates and controls have been applied and validated.

    We have identified no evidence of successful exploitation or unauthorized access to JMP systems or customer information associated with these vulnerabilities.

    JMP continues to monitor the issue and relevant vendor guidance. No action is required by JMP customers at this time.

  • Don’t miss your chance to experience Discovery Summit Europe at our best available rate! Early bird registration through 31 Oct.
  • Graph Builder Toolbar streamlines interactive graphing. Creates shortcuts on Report and GraphBuilder Helpers toolbars. Download and install the extension.

Discussions

Solve problems, and share tips and tricks with other JMP users.
Choose Language Hide Translation Bar
happy
Level II

QQ Plot behavior under factor coding and no-intercept model

Hi everyone,

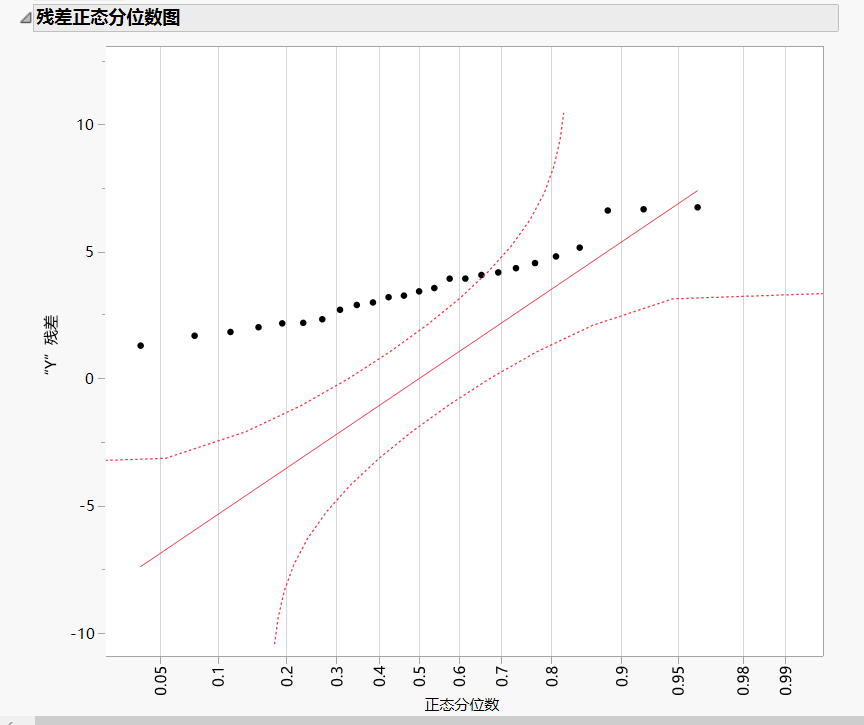
When I fit a model in JMP using factor coding and set the model to no intercept, I noticed that the residual normal quantile plot (QQ plot) behaves differently compared to the version with an intercept.

Specifically, the residuals and the fitted “robust fit line” in the QQ plot seem to shift vertically, and even after centering the residuals, the slope of the fitted line changes slightly. In addition, I also noticed that in some cases, the larger residuals (right side of the plot) still lie close to the fitted line, while the smaller residuals (left side) deviate more strongly.

I’m wondering how JMP internally handles residuals and the “robust fit line” calculation when the model is fit without an intercept and factors are effect coded.

Could anyone explain why this shift and slope difference occur, and how the QQ plot line and confidence curves are computed under this setting?

Thanks a lot for your help!

JMP PRO 17.1.0

0 REPLIES 0

Recommended Articles