- Learn how to build custom Python data connectors and further customize JMP’s Data Connector Framework with the Python Data Connector Demo, available now in the JMP Marketplace!
- See how to create experiments to support product design and ID useful product features. Register for June 12 webinar, 2pm US Eastern Time.
- Subscribe to RSS Feed
- Mark Topic as New
- Mark Topic as Read
- Float this Topic for Current User
- Bookmark
- Subscribe
- Mute
- Printer Friendly Page
Discussions
Solve problems, and share tips and tricks with other JMP users.- JMP User Community
- :
- Discussions
- :
- Possible to overlay text on a plot?

- Mark as New
- Bookmark
- Subscribe
- Mute
- Subscribe to RSS Feed
- Get Direct Link
- Report Inappropriate Content
Possible to overlay text on a plot?
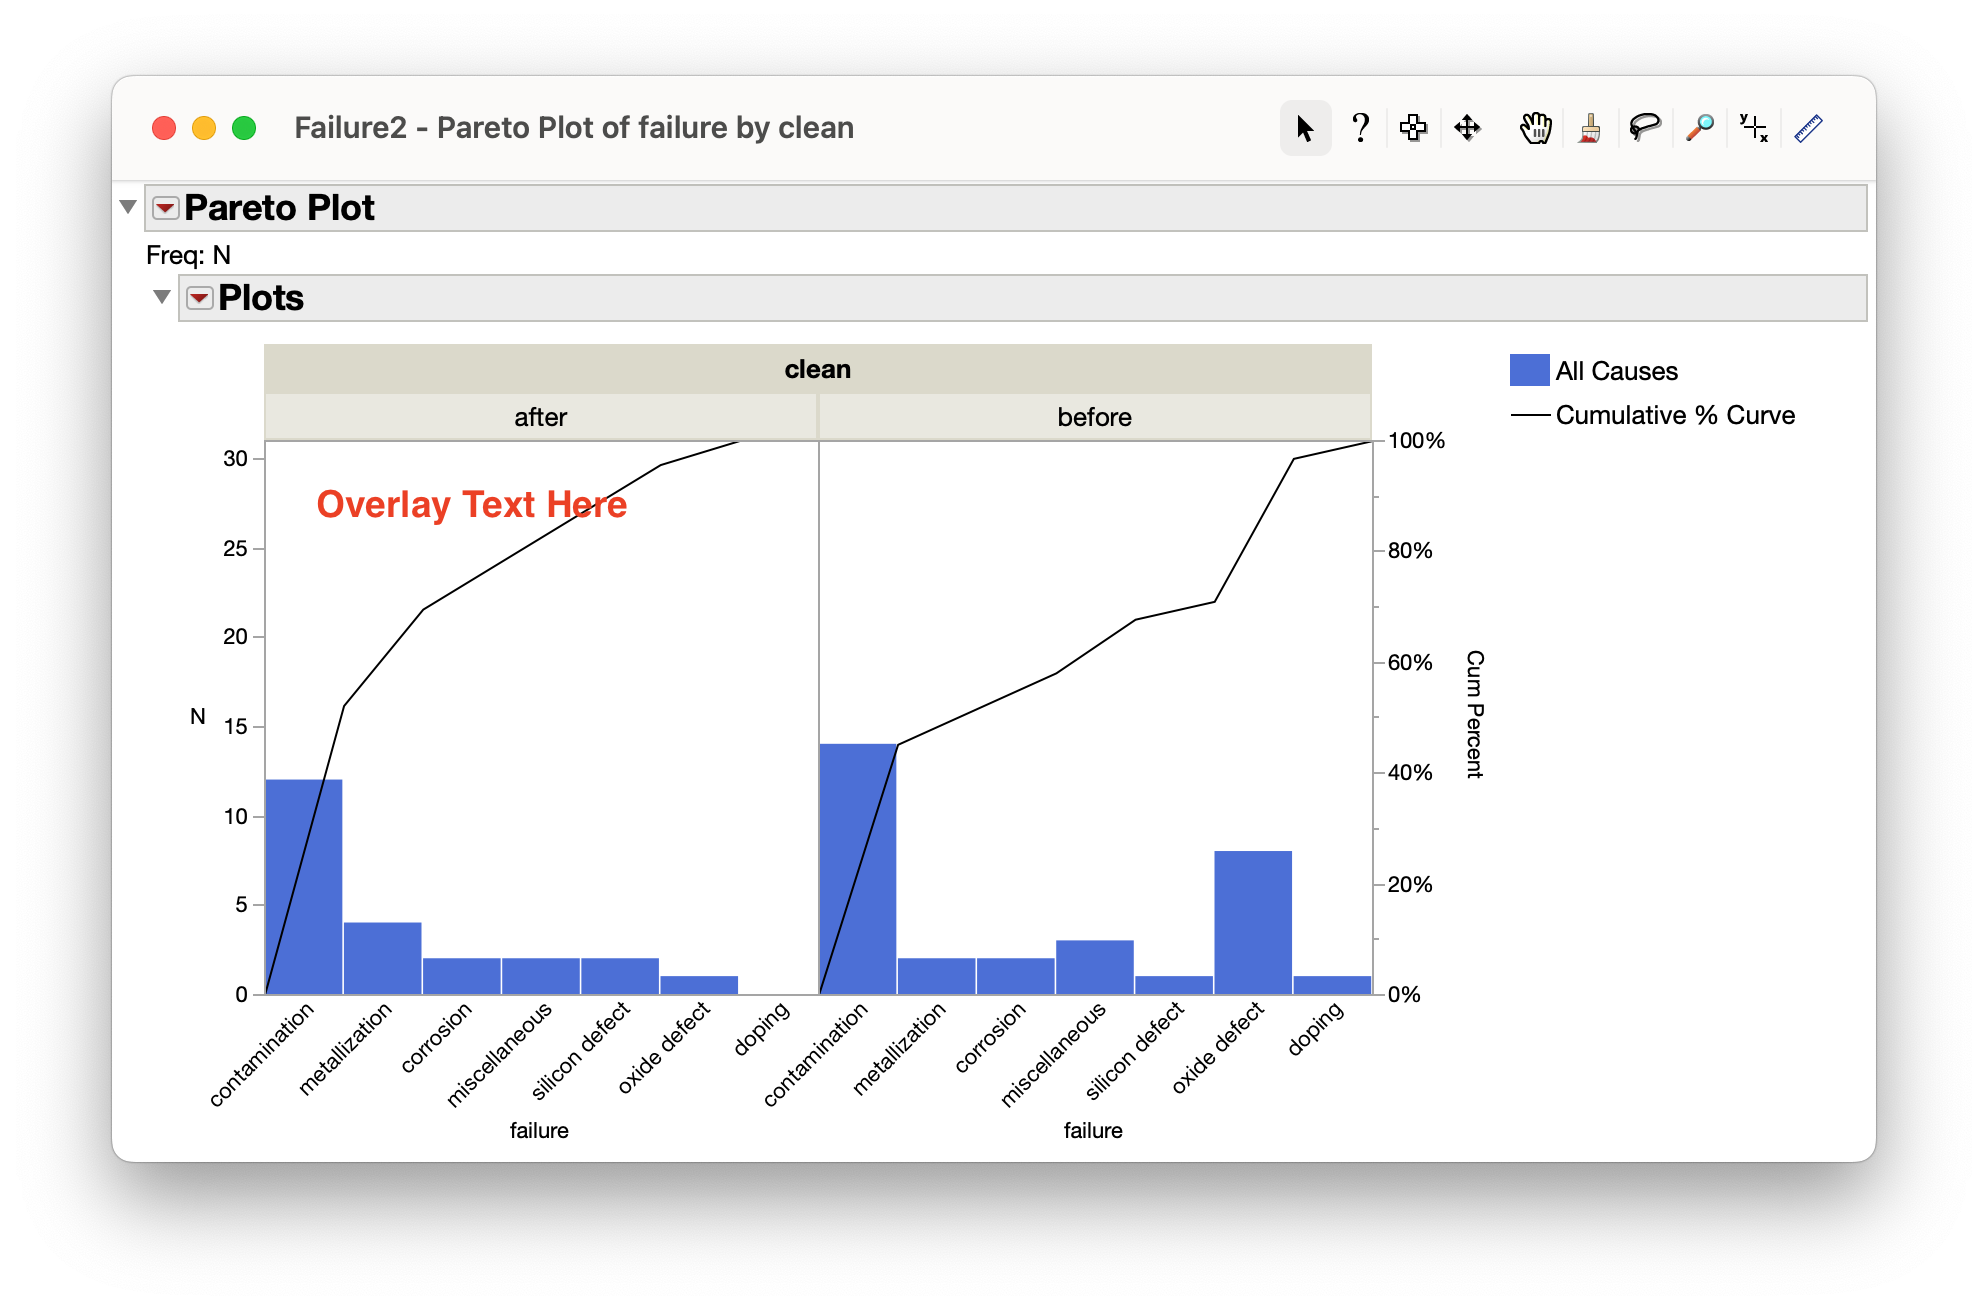
Hi. Does anyone know if there is a scripting method to add text on top of a plot? For example, I have a script to create a pareto plot and I'd like to add text over the plot, as shown in the attached file. Note I don't mean adding a title above the plot. I mean to ask if there is a way to actually place the text within the plot area. I feel there is a way, but so far my search has been unsuccessful. Thanks!
Using JMP Pro 17.2.0.
Accepted Solutions

- Mark as New
- Bookmark
- Subscribe
- Mute
- Subscribe to RSS Feed
- Get Direct Link
- Report Inappropriate Content
Re: Possible to overlay text on a plot?
Build the graph as you want it to be. Then using the annotation tool icons select the text icon

and add in the text you want on the place on the graph where you want it. Right clicking on the annotation will allow you to set the font and color etc.

Then go to the red triangle and select to save the script to a script window, and you will get a script that will create the graph and the annotation.
Graph Builder(
	Size( 522, 486 ),
	Show Control Panel( 0 ),
	Variables(
		X( :age, Order By( :age, Descending, Order Statistic( "N" ) ) ),
		Group X( :sex )
	),
	Elements( Bar( X, Legend( 8 ) ) ),
	SendToReport(
		Dispatch(
			{},
			"Graph Builder",
			FrameBox,
			Add Text Annotation(
				Text( "Overlay Text Here" ),
				Fixed Size( 0 ),
				Text Box( {46, 31, 224, 68} ),
				Text Color( "Medium Dark Red" ),
				Font( "Segoe UI", 14, "Bold" ),
				Filled( 0 )
			)
		)
	)
);
- Mark as New
- Bookmark
- Subscribe
- Mute
- Subscribe to RSS Feed
- Get Direct Link
- Report Inappropriate Content
Re: Possible to overlay text on a plot?
Build the graph as you want it to be. Then using the annotation tool icons select the text icon
and add in the text you want on the place on the graph where you want it. Right clicking on the annotation will allow you to set the font and color etc.
Then go to the red triangle and select to save the script to a script window, and you will get a script that will create the graph and the annotation.
Graph Builder(
	Size( 522, 486 ),
	Show Control Panel( 0 ),
	Variables(
		X( :age, Order By( :age, Descending, Order Statistic( "N" ) ) ),
		Group X( :sex )
	),
	Elements( Bar( X, Legend( 8 ) ) ),
	SendToReport(
		Dispatch(
			{},
			"Graph Builder",
			FrameBox,
			Add Text Annotation(
				Text( "Overlay Text Here" ),
				Fixed Size( 0 ),
				Text Box( {46, 31, 224, 68} ),
				Text Color( "Medium Dark Red" ),
				Font( "Segoe UI", 14, "Bold" ),
				Filled( 0 )
			)
		)
	)
);
- Mark as New
- Bookmark
- Subscribe
- Mute
- Subscribe to RSS Feed
- Get Direct Link
- Report Inappropriate Content
Re: Possible to overlay text on a plot?
Thanks Jim. That's exactly what I needed. Works perfectly.

- Mark as New
- Bookmark
- Subscribe
- Mute
- Subscribe to RSS Feed
- Get Direct Link
- Report Inappropriate Content
Re: Possible to overlay text on a plot?
Another approach is to add a graphics script. Many graphics functions support the display of text:

Here is an example of another way to add text to a plot:
Names Default to Here( 1 );

dt = Open( "$SAMPLE_DATA/Big Class.jmp" );

obj = dt << Graph Builder(
	Size( 534, 456 ),
	Show Control Panel( 0 ),
	Variables( X( :height ), Y( :weight ) ),
	Elements( Points( X, Y, Legend( 3 ) ), Smoother( X, Y, Legend( 4 ) ) )
);

rpt = obj << Report;

rpt[FrameBox(1)] << Add Graphics Script(
	Text( { 55, 160 }, "Here I am!" )
);
Recommended Articles
- © 2026 JMP Statistical Discovery LLC. All Rights Reserved.
- Terms of Use
- Privacy Statement
- Contact Us