This website uses Cookies. Click Accept to agree to our website's cookie use as described in our Privacy Policy. Click Preferences to customize your cookie settings.
- JMP User Community
- :
- Discussions
- :
- Re: PCA - color map on correlations
Turn on suggestions
Auto-suggest helps you quickly narrow down your search results by suggesting possible matches as you type.
Have your say in shaping JMP's future by participating in the new
JMP Wish List Prioritization Survey
Topic Options
- Subscribe to RSS Feed
- Mark Topic as New
- Mark Topic as Read
- Float this Topic for Current User
- Bookmark
- Subscribe
- Printer Friendly Page

Level I
- Mark as New
- Bookmark
- Subscribe
- Mute
- Subscribe to RSS Feed
- Get Direct Link
- Report Inappropriate Content
PCA - color map on correlations
Mar 19, 2019 06:25 AM
(7220 views)
Hi everyone,
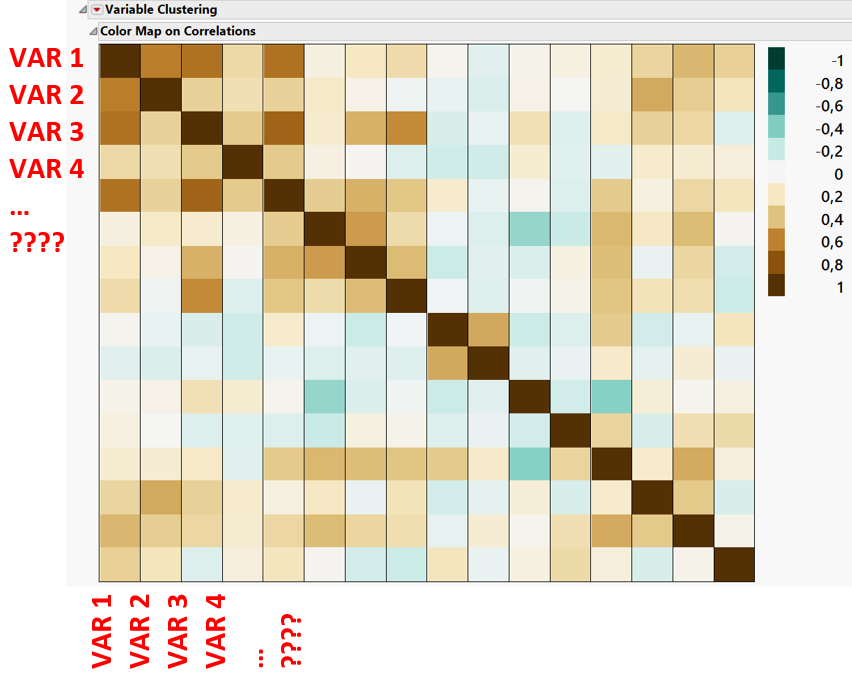
I'm performing a PCA analysis and I really like to visualize the correlations using the 'color map on correlations'. However, I would like to have my variabale labels' at the x and y of this graph (see attached image). Is there any way to do this?
Thank you!
3 REPLIES 3

Staff
- Mark as New
- Bookmark
- Subscribe
- Mute
- Subscribe to RSS Feed
- Get Direct Link
- Report Inappropriate Content
Re: PCA - color map on correlations
FYI, I note that 'Analyze > Mulitvariate Methods > Multivariate' gives you half of what you want:


Level VI
- Mark as New
- Bookmark
- Subscribe
- Mute
- Subscribe to RSS Feed
- Get Direct Link
- Report Inappropriate Content
Re: PCA - color map on correlations
Created:
Mar 20, 2019 05:05 PM
| Last Modified: Mar 20, 2019 05:06 PM
(7170 views)
| Posted in reply to message from Omega 03-19-2019
You can do this with a few steps:
In multivariate platform or principle components platform, display the correlation matrix.
Then right-click the matrix and select "Make into Data Table".

Resulting in this new table

You will have to do some manipulation of that table of correlations:
Use Tables > Stack to create a tall version of the table that 3 columns: A column with the variable names to use for categories on the X axis, another column with categories for the Y axis, and a column with correlation of the variables in the previous two columns.

Now you can use the Graph Builder to create the heat map of these correlations. I did have to reverse the order of the variables on the X axis in the axis settings to get what you wanted.

Here's a script that recreates all those steps on the sample data table ("Body Measurements.JMP") that I used to illustrate all of this.
dt = Open( "$SAMPLE_DATA/Body Measurements.jmp" );
pca = dt << Principal Components(
	Y(
		:Mass,
		:Fore,
		:Bicep,
		:Chest,
		:Neck,
		:Shoulder,
		:Waist,
		:Height,
		:Calf,
		:Thigh,
		:Head
	),
	Correlations( 1 ),

);

dtcorr = Report( pca )["Correlations"][Matrix Box( 1 )] <<
Make Into Data Table;

dtcorrstacked = dtcorr << Stack(
	columns(
		:Mass,
		:Fore,
		:Bicep,
		:Chest,
		:Neck,
		:Shoulder,
		:Waist,
		:Height,
		:Calf,
		:Thigh,
		:Head
	),
	Source Label Column( "VariableYAxis" ),
	Stacked Data Column( "Correlation" )
);
dtcorrstacked << Set Name( "Stacked Correlations" );
Close( dtcorr, NoSave );
Column( dtcorrstacked, "Row" ) << Set Name( "VariableXAxis" );
dtcorrstacked << Graph Builder(
	Size( 531, 531 ),
	Show Control Panel( 0 ),
	Graph Spacing( 4 ),
	Variables(
		X( :VariableXAxis ),
		Y( :VariableYAxis ),
		Color( :Correlation )
	),
	Elements( Heatmap( X, Y, Legend( 6 ) ) ),
	SendToReport(
		Dispatch( {}, "VariableXAxis", ScaleBox, {Reversed Scale} )
	)
);
Level VI
- Mark as New
- Bookmark
- Subscribe
- Mute
- Subscribe to RSS Feed
- Get Direct Link
- Report Inappropriate Content
Re: PCA - color map on correlations
I was going through some of my old posts, and I wanted to update this thread. You will be happy to know that in JMP 15, the color map on correlations has been improved and does what you were wanting in the original post.

I love it when the JMP development team listens and makes even small improvements like this that delight their customers!
- © 2024 JMP Statistical Discovery LLC. All Rights Reserved.
- Terms of Use
- Privacy Statement
- About JMP
- JMP Software
- JMP User Community
- Contact