Turn on suggestions
Auto-suggest helps you quickly narrow down your search results by suggesting possible matches as you type.
- Instantly extract effect sizes, F-ratios, and FDR-adjusted p-values from your models with the Calculate Effects Sizes extension, available now in the JMP Marketplace!
- New to JMP? Join us Sept. 23-24 for the Early User Edition of Discovery Summit, tailor-made for new users. Register now for free!
- Your voice matters! Tell us how you prefer to receive JMP updates, so we can tailor our communication to your needs. Take short survey.
Options
- Subscribe to RSS Feed
- Mark Topic as New
- Mark Topic as Read
- Float this Topic for Current User
- Bookmark
- Subscribe
- Mute
- Printer Friendly Page
Discussions
Solve problems, and share tips and tricks with other JMP users.- JMP User Community
- :
- Discussions
- :
- Normalized rare earth element plots

Level I
- Mark as New
- Bookmark
- Subscribe
- Mute
- Subscribe to RSS Feed
- Get Direct Link
- Report Inappropriate Content
Normalized rare earth element plots
Created:
May 9, 2021 09:01 PM
| Last Modified: Jun 11, 2023 4:13 AM
(3855 views)
HI all,
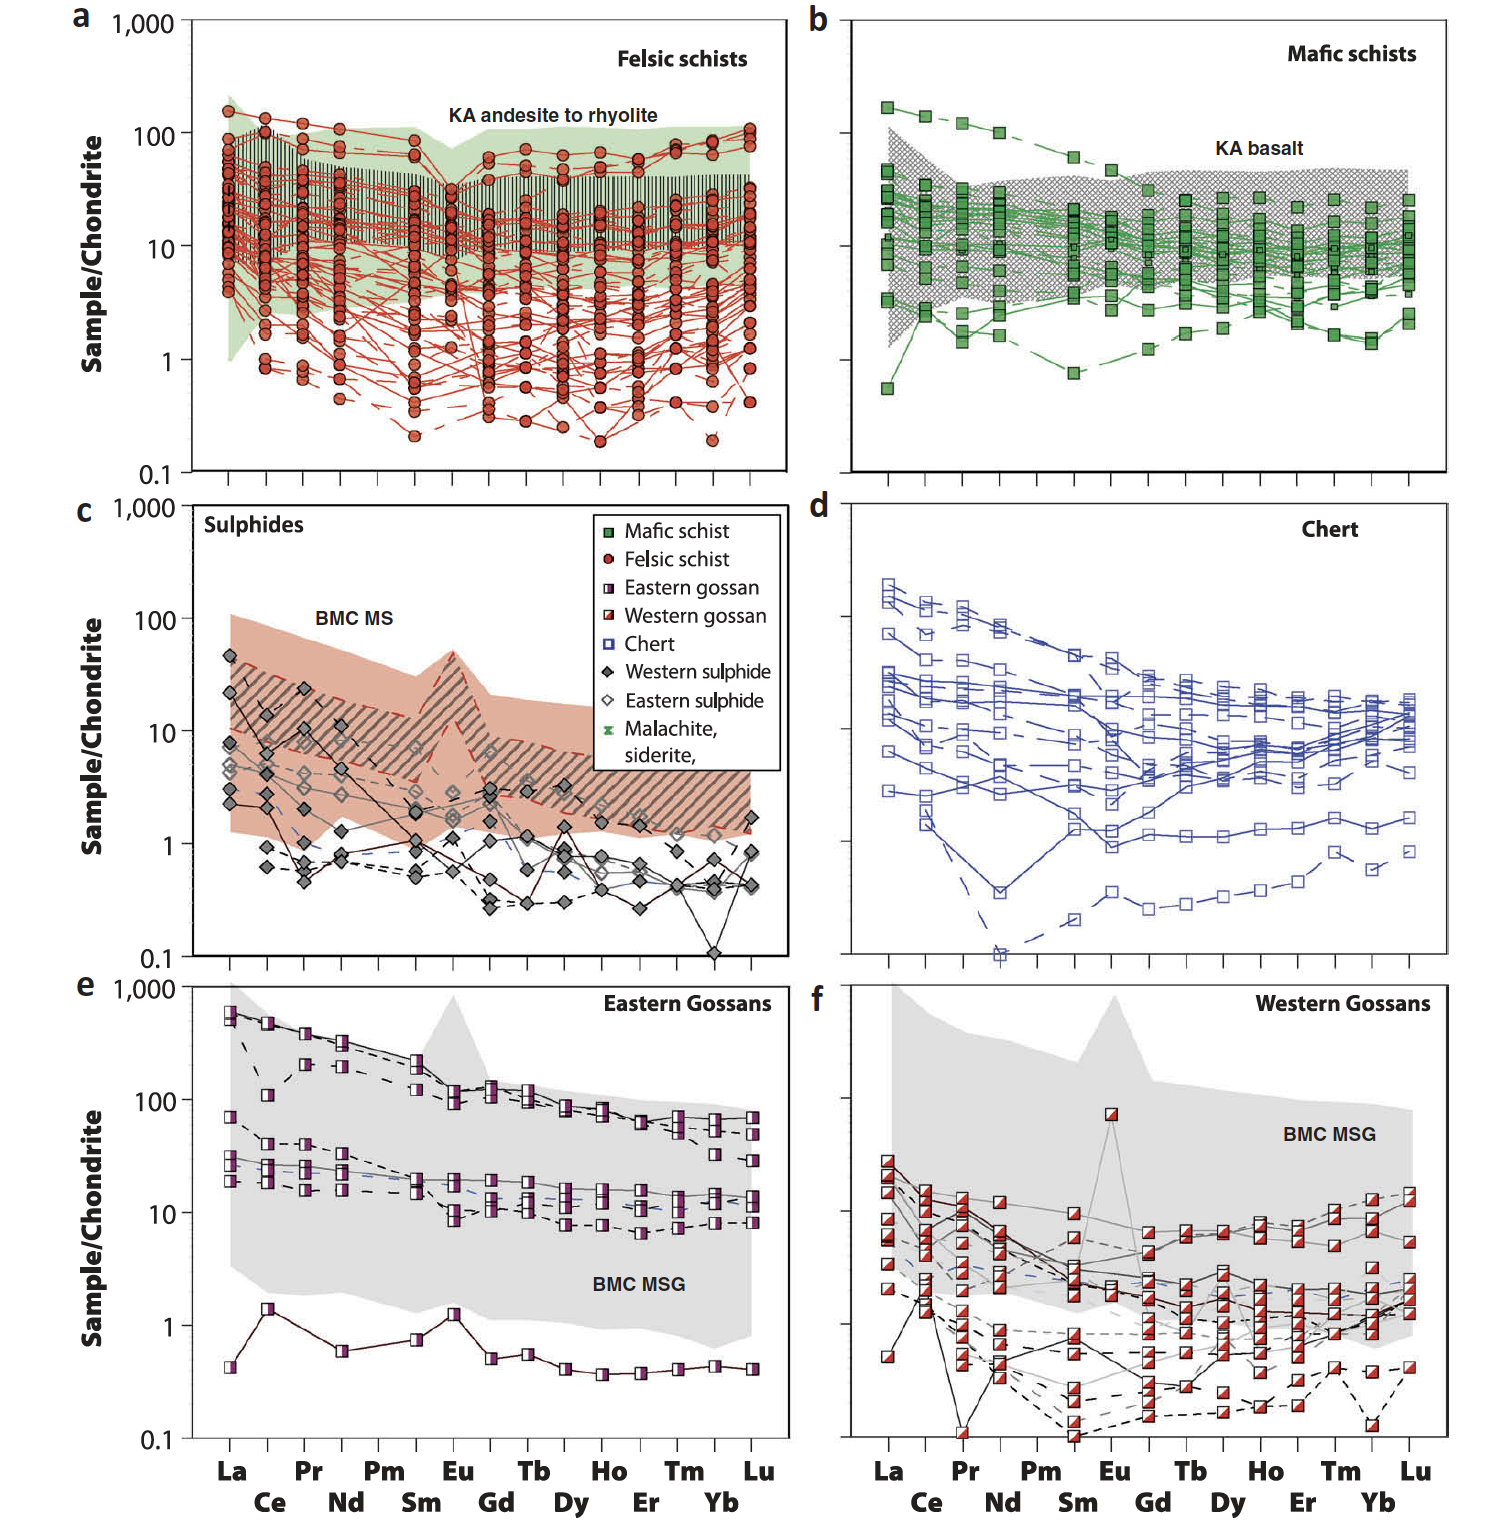
I am trying to plot line plots where all the rare earth element are normalized to some value - typically this is a value for each REE in a chondrite. This used to be very easy in a program called Aabel by Gigawiz, but they seem to be defunct now. So, I am migrating to JMP, but cannot see an easy way to do this. I can in excel, but its a bit of a mess. Any thoughts? I have attached an example.
Cheers
3 REPLIES 3

Super User
- Mark as New
- Bookmark
- Subscribe
- Mute
- Subscribe to RSS Feed
- Get Direct Link
- Report Inappropriate Content
Re: Normalized rare earth element plots
Hi,
Have you looked into the column formula "STANDARDIZE": Essentially, it centers the distribution and scale it the the standard deviation yielding normalized values?
Best,
TS
Have you looked into the column formula "STANDARDIZE": Essentially, it centers the distribution and scale it the the standard deviation yielding normalized values?
Best,
TS
Thierry R. Sornasse
Level I
- Mark as New
- Bookmark
- Subscribe
- Mute
- Subscribe to RSS Feed
- Get Direct Link
- Report Inappropriate Content
Re: Normalized rare earth element plots
Thanks. but that is not really what I am trying to do. In geochemistry we normalize the REE to remove the Oddo-Harkins effect of odd-even isotopic abundances in the (known) universe. Produces smooth patterns, which deviations from each other reflect different geochemical processes

Staff
- Mark as New
- Bookmark
- Subscribe
- Mute
- Subscribe to RSS Feed
- Get Direct Link
- Report Inappropriate Content
Re: Normalized rare earth element plots
Hi, can you explain more about the normalisation that you need to do? The chart looks like it should be easy to produce in JMP once you have the data in the form required. Are you able to share an example of the type of data? I think that would really help the community to answer your question.
Recommended Articles
- © 2026 JMP Statistical Discovery LLC. All Rights Reserved.
- Terms of Use
- Privacy Statement
- Contact Us