- Don’t miss your chance to experience Discovery Summit Europe at our best available rate! Early bird registration through 31 Oct.
- Graph Builder Toolbar streamlines interactive graphing. Creates shortcuts on Report and GraphBuilder Helpers toolbars. Download and install the extension.
- Subscribe to RSS Feed
- Mark Topic as New
- Mark Topic as Read
- Float this Topic for Current User
- Bookmark
- Subscribe
- Mute
- Printer Friendly Page
Discussions
Solve problems, and share tips and tricks with other JMP users.- User Community
- :
- Discussions
- :
- Re: New to Gage R and R analysis, EV% over 100%?

- Mark as New
- Bookmark
- Subscribe
- Mute
- Subscribe to RSS Feed
- Get Direct Link
- Report Inappropriate Content
New to Gage R and R analysis, EV% over 100%?
Hello,
I am trying to understand the variability of measurements in a test tool I have created (I am measuring 3-axis Acceleration) and was told about Gage R and R.
The study was set up as followed: 1 Part, 3 Operators, 10 Measurements per Operator (I do not care about part variability in this case and that is why only the single part was measured).
Using the Gage R and R analysis Tool in JMP, Here is an image of the results:
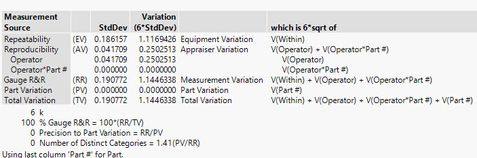
Thru research, it seems the tool should have a maximum EV% of 30%. In the Table, which value would be the EV%? is it the 1.116 value? it is possible to have a EV% of over 100%? is my measurement variability just that terrible?
Thanks in advance for any help!


- Mark as New
- Bookmark
- Subscribe
- Mute
- Subscribe to RSS Feed
- Get Direct Link
- Report Inappropriate Content
Re: New to Gage R and R analysis, EV% over 100%?
That 1.117 number is not actually a ratio; that's the actual estimate of the repeatability variance. That 30% refers to the ratio of the repeatability variance to the total variance. You may not care about part variation, but it is a critical point of reference to judge the quality of your measurement system, and many traditional GRR metrics do not make sense without that component. Since you have 0 part variation represented in your total variance, the repeatability will account for very close to 100% of the total variation (1.117/1.145).
If sample-to-sample (part-to-part) variation is really not important in the context of your measurement system, you'll need to select more appropriate metrics. Maybe something like a coefficient of variation?


- Mark as New
- Bookmark
- Subscribe
- Mute
- Subscribe to RSS Feed
- Get Direct Link
- Report Inappropriate Content
Re: New to Gage R and R analysis, EV% over 100%?
I completely agree with @cwillden's conclusion about your analysis. You are not performing a Gage R&R or any kind of Measure System Analysis (MSA) in this case. You cannot judge the performance of the tool by itself. The same tool might provide very good measurements in one situation and poor ones in another. The difference? What is it expected to distinguish? That is based on the amount of part variation.
Where did your get research information? I have never seen any presentation of Gage R&R in the absence of part variation. (I admit that it might exist, though.)
What is the basis given for an upper bound of 30% EV? Is it relative to the total variation? Your EV is over 80%:

Such 'rules of thumb' are often not meaningful or helpful in a particular situation. For example, if my EV is high but the measurement is cheap (e.g., cost, time), I can determine the number of replicate measurements to average and reduce this component. On the other hand, if my EV is high and the measurement is expensive, then I might have to find the root source of this variation and reduce or eliminate it or find another tool.


- Mark as New
- Bookmark
- Subscribe
- Mute
- Subscribe to RSS Feed
- Get Direct Link
- Report Inappropriate Content
Re: New to Gage R and R analysis, EV% over 100%?
Realize that the Gage R&R study is meant to compare the components of measurement precision (repeatability and reproducibility) to that which you are measuring (or want to be able to differentiate). Do you need to detect part-to-part variation? Then you need to compare the measurement components to part-tp-part variation (which does not exist in your study). Do you need to detect within part variation? Then you would need multiple measures within part to compare the measurement components to. Make sense?
Recommended Articles
- © 2026 JMP Statistical Discovery LLC. All Rights Reserved.
- Terms of Use
- Privacy Statement
- Contact Us