cancel
Showing results for 
Show  only  | Search instead for 
Did you mean: 
  • Image to Table JMP extension imports single or batch images as data tables. Useful to extract curves from pictures or convert image data to curve data to use in analyses like Functional Data Explorer. Download and install the extension.

Discussions

Solve problems, and share tips and tricks with other JMP users.
Choose Language Hide Translation Bar
rahulsmils
Level III

Legend based on 2 columns

Dear all,


I have a huge data table like following


Continent        State          City                  Population

USA              Pennsylvania          Philadelphia           ----

 USA              Pennsylvania        Harrisburg                ----

USA              California                San Diego

USA              California                San Fransisco

 Europe       France                      Paris

  Europe       France                                                             another_city_in_France


I am creating a scatter plot of the population.  In order to put a legend, I want to use a unique marker for each state.

Then for each state , I want to color that marker differently corresponding to each city.


I know if I do row legend, I can color by a particular  column. But if I need to color and mark in above mentioned way, I want to know the most efficient way to do it.


Right now I create a summary of state and then assign markers.

Then I select all rows corresponding to a particular state and assign colors to that set manually, which is very inefficient for the long data table.


Thanks



1 REPLY 1
txnelson
Super User

Re: Legend based on 2 columns

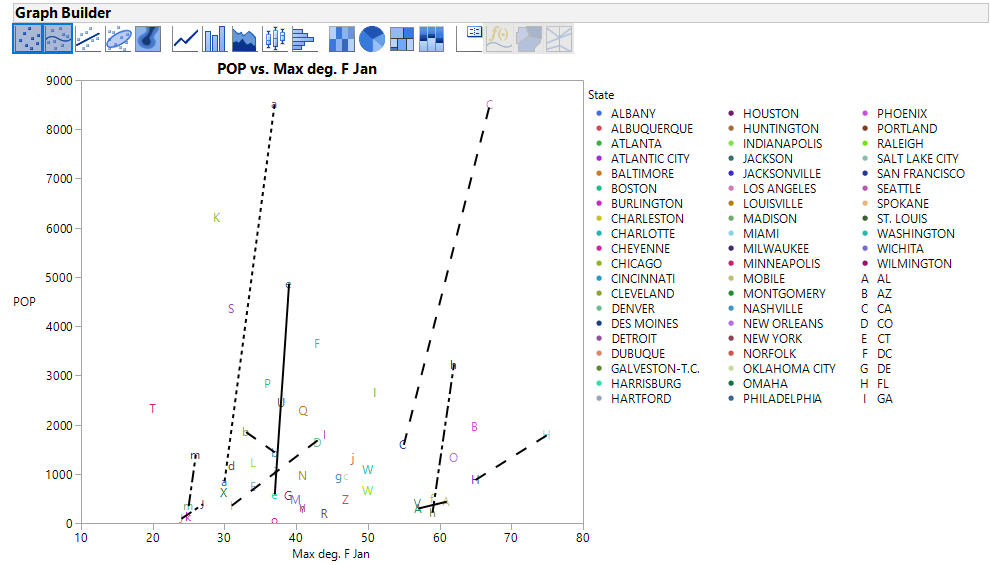
Here is an example using Graph Builder.  Population is on the Y axis, I couldn't tell what you were using for your X axis so I just chose Ozone level.  I Overlayed by State and Colored by City.Cities by states.png


Jim

Recommended Articles