- Instantly extract effect sizes, F-ratios, and FDR-adjusted p-values from your models with the Calculate Effects Sizes extension, available now in the JMP Marketplace!
- New to JMP? Join us Sept. 23-24 for the Early User Edition of Discovery Summit, tailor-made for new users. Register now for free!
- Your voice matters! Tell us how you prefer to receive JMP updates, so we can tailor our communication to your needs. Take short survey.
- Subscribe to RSS Feed
- Mark Topic as New
- Mark Topic as Read
- Float this Topic for Current User
- Bookmark
- Subscribe
- Mute
- Printer Friendly Page
Discussions
Solve problems, and share tips and tricks with other JMP users.- JMP User Community
- :
- Discussions
- :
- Joining tables with different levels of precision

- Mark as New
- Bookmark
- Subscribe
- Mute
- Subscribe to RSS Feed
- Get Direct Link
- Report Inappropriate Content
Joining tables with different levels of precision
I have a table which gives the dates and times when changes were implemented which are roughly a week apart. I have another table of data with much finer times (on the order of minutes) which I’d like to join to the first table. How can I get the proper change level to be listed in a row which doesn’t have the same date/time?
For example, Table 1 could list change level 1 as happening on March 1 at 1:00 PM and change level 2 happening on March 8 at 6:00AM. Table 2 might have data on March 3 at 3:30 PM. I'd like to join the tables such that the row in Table 2 listing March 3 at 3:30 PM also lists change level 1.
Thanks!
Accepted Solutions

- Mark as New
- Bookmark
- Subscribe
- Mute
- Subscribe to RSS Feed
- Get Direct Link
- Report Inappropriate Content
Re: Joining tables with different levels of precision
Hey, Kennedy3,
I think this is a common problem because of sensors that only record changes in levels rather than recording levels even if unchanged at fixed intervals, so I decided to give it a little thought. The only way I know how to do this is with a compound query that might be prohibitively inefficient for large tables, or maybe you could come up with a variation that could be more efficient.
Here is an example: Let's say I run a country club, and I am looking at the relationship between the number of golfers and the temperature. All I have for temperature data is a table of the average weekly temperature:

For number of golfers, I have a summer student working for me on random days, and I had her count the golfers. Here is her data:

Note that the dates where she counted golfers do not correspond to the dates for the average high temperature readings. What I would like to do for each date she counted golfers is find the temperature reading for the beginning of that week. If I join the two tables with the condition "Week <= TestDate", using this SQL:
SELECT t2.TestDate, t1.Week
FROM dbo.Golfers t2
LEFT OUTER JOIN dbo.AvgHighTemps t1
ON ( t1.Week <= t2.TestDate )
ORDER BY t2.TestDate ASC;
I will get a table that looks like this:

Note that each TestDate now has multiple matching weeks. But if I pull out the row that has the largest Week date that is less than the TestDate, that will be the week I want. I can do that with this SQL:
SELECT t2.TestDate, MAX(t1.Week) AS Week
FROM dbo.AvgHighTemps t1
FULL OUTER JOIN dbo.Golfers t2
ON ( t2.TestDate >= t1.Week )
GROUP BY t2.TestDate
ORDER BY t2.TestDate ASC;
and the resulting table looks like this:

Now comes the tricky part. I need to use that query as a subquery, joining the other two tables to it, to get the result I want. Here is the SQL:
SELECT t1.Week, t1.AvgHighTemp, t2.TestDate, t2.NGolfers
FROM (
     SELECT t1.TestDate, MAX(t2.Week) as TempWeek
     FROM dbo.Golfers t1
     LEFT OUTER JOIN dbo.AvgHighTemps t2
     ON ( t2.Week <= t1.TestDate )
     GROUP BY t1.TestDate
  ) tempFinder
  RIGHT OUTER JOIN dbo.AvgHighTemps t1
  ON t1.Week = tempFinder.TempWeek
  RIGHT OUTER JOIN dbo.Golfers t2
  ON t2.TestDate = tempFinder.TestDate
;
The result is a table that has the number of golfers and the average temperature for the corresponding week:

That's a bit of work to get there, but I personally don't know of another way to do it.
Hope this helps,
Eric

- Mark as New
- Bookmark
- Subscribe
- Mute
- Subscribe to RSS Feed
- Get Direct Link
- Report Inappropriate Content
Re: Joining tables with different levels of precision
I think of this as 'interleaving' rather than 'joining', and there is surely more than one result that might be desirable.
I dug out some old code that I think is is close to what you want. Also, even within the world of JSL there will be good and less good ways to get to where you want to be. So, as an alternative to Eric's approach, please see below. I'm sure it could be made more efficient, and that might be something others could like to take a crack at . . .
NamesDefaultToHere(1);
// Make some 'date' data in two tables
nf = 100;
vals = J(nf, 1, RandomInteger(DateDMY(1,1,2014), DateDMY(31,12,2014)));
dtFine = NewTable("Date and Times in 2014 - Fine",
NewColumn("Date", Numeric, Continuous,
Format( "ddMonyyyy h:m:s", 22, 0 ),
Input Format( "ddMonyyyy h:m:s", 0 ),
Values(vals)
)
);
nc = 10;
vals = J(nc, 1, RandomInteger(DateDMY(1,1,2014), DateDMY(31,12,2014)));
dtCoarse = NewTable("Date and Times in 2014 - Coarse",
NewColumn("Date", Numeric, Continuous,
Format( "ddMonyyyy h:m:s", 22, 0 ),
Input Format( "ddMonyyyy h:m:s", 0 ),
Values(vals)
),
NewColumn("Temperature", Numeric, Continuous, Formula(RandomNormal(18, 2)))
);
dtFine << Sort( By( :Date ), Order( Ascending ), ReplaceTable );
dtCoarse << Sort( By( :Date ), Order( Ascending ), ReplaceTable );
// ******************************************************************************************************
// Interleave the coarse data with the fine data
// ******************************************************************************************************
// Add the columns from dtCoarse to dtFine
Wait(3);
n = NCol(dtFine);
cols = dtCoarse << getColumnNames("String");
For(c=1, c<=NItems(cols), c++,
dtype = Column(dtCoarse, cols[c]) << getDataType;
mtype = Column(dtCoarse, cols[c]) << getModelingType;
addCol = Expr(dtFine << NewColumn(cols[c], dtype, mtype, formatTBD));
SubstituteInto(addCol, Expr(formatTBD), Column(dtCoarse, cols[c]) << getFormat);
addCol;
);
// ******************************************************************************************************
// The logic relies on the two tables being sorted in ascending order!
// ******************************************************************************************************
fineDT = Column(dtFine, "Date") << getValues;
coarseDT = Column(dtCoarse, "Date") << getValues;
if(
// No time in dtCoarse is later than the earliest time in dtFine, so insert values in the first row in the latter
Max(coarseDT) < Min(fineDT),
For(c=1, c<=NItems(cols), c++,
Column(dtFine, n+c)[1] = Column(dtCoarse, cols[c])[NRow(dtCoarse)];
),
// Else . . .
// pos will contain the positions of the rows in dtFine at which the values in dtCoarse should be inserted.
// (Note: If a value in pos is bigger than NRow(dtFine), no row is added to the latter and no error results).
pos = LocSorted(fineDT, coarseDT);
pos = pos + J(NRow(pos), 1, 1);
// Insert values in cells
For(p=1, p<=NRow(pos), p++,
For(c=1, c<=NItems(cols), c++,
Column(dtFine, n+c)[pos[p]] = Column(dtCoarse, cols[c])[p];
);
);
);

- Mark as New
- Bookmark
- Subscribe
- Mute
- Subscribe to RSS Feed
- Get Direct Link
- Report Inappropriate Content
Re: Joining tables with different levels of precision
I've dealt with a similar issue in monitoring various sensors in my home. I have 5 sensors throughout the house, which measure temp, humidity and illumination. They send measurements to a central hub (SmartThings) every 8 minutes unless the value has not changed from the previous value. I also have a continuous power meter, which measure power utilization in the house.
The way I've dealt with this problem is to build a "year of 5 minutes" JMP data table, which has samples every 5 minutes for a year. And then I interleave the values from my 20 sensors into this year of 5 minutes table using a script. So if I have a reading at that particular sample for a sensor it gets recorded, if not there is a missing value.
Year of 5 mins:

I have another script, which lets me visualize "sensor health" -- basically a "IsMissing" check. This lets me know when I have network issues, sensor problems etc. It's been very helpful. And also visualize if my join is working.

So basically the strategy was to employ a master sampling table at the shortest time interval I would have in my measurements (every minutes) and the Join each sensor to that master table.
- Mark as New
- Bookmark
- Subscribe
- Mute
- Subscribe to RSS Feed
- Get Direct Link
- Report Inappropriate Content
Re: Joining tables with different levels of precision
Hey, Kennedy3,
I think this is a common problem because of sensors that only record changes in levels rather than recording levels even if unchanged at fixed intervals, so I decided to give it a little thought. The only way I know how to do this is with a compound query that might be prohibitively inefficient for large tables, or maybe you could come up with a variation that could be more efficient.
Here is an example: Let's say I run a country club, and I am looking at the relationship between the number of golfers and the temperature. All I have for temperature data is a table of the average weekly temperature:
For number of golfers, I have a summer student working for me on random days, and I had her count the golfers. Here is her data:
Note that the dates where she counted golfers do not correspond to the dates for the average high temperature readings. What I would like to do for each date she counted golfers is find the temperature reading for the beginning of that week. If I join the two tables with the condition "Week <= TestDate", using this SQL:
SELECT t2.TestDate, t1.Week
FROM dbo.Golfers t2
LEFT OUTER JOIN dbo.AvgHighTemps t1
ON ( t1.Week <= t2.TestDate )
ORDER BY t2.TestDate ASC;
I will get a table that looks like this:
Note that each TestDate now has multiple matching weeks. But if I pull out the row that has the largest Week date that is less than the TestDate, that will be the week I want. I can do that with this SQL:
SELECT t2.TestDate, MAX(t1.Week) AS Week
FROM dbo.AvgHighTemps t1
FULL OUTER JOIN dbo.Golfers t2
ON ( t2.TestDate >= t1.Week )
GROUP BY t2.TestDate
ORDER BY t2.TestDate ASC;
and the resulting table looks like this:
Now comes the tricky part. I need to use that query as a subquery, joining the other two tables to it, to get the result I want. Here is the SQL:
SELECT t1.Week, t1.AvgHighTemp, t2.TestDate, t2.NGolfers
FROM (
     SELECT t1.TestDate, MAX(t2.Week) as TempWeek
     FROM dbo.Golfers t1
     LEFT OUTER JOIN dbo.AvgHighTemps t2
     ON ( t2.Week <= t1.TestDate )
     GROUP BY t1.TestDate
  ) tempFinder
  RIGHT OUTER JOIN dbo.AvgHighTemps t1
  ON t1.Week = tempFinder.TempWeek
  RIGHT OUTER JOIN dbo.Golfers t2
  ON t2.TestDate = tempFinder.TestDate
;
The result is a table that has the number of golfers and the average temperature for the corresponding week:
That's a bit of work to get there, but I personally don't know of another way to do it.
Hope this helps,
Eric
- Mark as New
- Bookmark
- Subscribe
- Mute
- Subscribe to RSS Feed
- Get Direct Link
- Report Inappropriate Content
Re: Joining tables with different levels of precision
I think of this as 'interleaving' rather than 'joining', and there is surely more than one result that might be desirable.
I dug out some old code that I think is is close to what you want. Also, even within the world of JSL there will be good and less good ways to get to where you want to be. So, as an alternative to Eric's approach, please see below. I'm sure it could be made more efficient, and that might be something others could like to take a crack at . . .
NamesDefaultToHere(1);
// Make some 'date' data in two tables
nf = 100;
vals = J(nf, 1, RandomInteger(DateDMY(1,1,2014), DateDMY(31,12,2014)));
dtFine = NewTable("Date and Times in 2014 - Fine",
NewColumn("Date", Numeric, Continuous,
Format( "ddMonyyyy h:m:s", 22, 0 ),
Input Format( "ddMonyyyy h:m:s", 0 ),
Values(vals)
)
);
nc = 10;
vals = J(nc, 1, RandomInteger(DateDMY(1,1,2014), DateDMY(31,12,2014)));
dtCoarse = NewTable("Date and Times in 2014 - Coarse",
NewColumn("Date", Numeric, Continuous,
Format( "ddMonyyyy h:m:s", 22, 0 ),
Input Format( "ddMonyyyy h:m:s", 0 ),
Values(vals)
),
NewColumn("Temperature", Numeric, Continuous, Formula(RandomNormal(18, 2)))
);
dtFine << Sort( By( :Date ), Order( Ascending ), ReplaceTable );
dtCoarse << Sort( By( :Date ), Order( Ascending ), ReplaceTable );
// ******************************************************************************************************
// Interleave the coarse data with the fine data
// ******************************************************************************************************
// Add the columns from dtCoarse to dtFine
Wait(3);
n = NCol(dtFine);
cols = dtCoarse << getColumnNames("String");
For(c=1, c<=NItems(cols), c++,
dtype = Column(dtCoarse, cols[c]) << getDataType;
mtype = Column(dtCoarse, cols[c]) << getModelingType;
addCol = Expr(dtFine << NewColumn(cols[c], dtype, mtype, formatTBD));
SubstituteInto(addCol, Expr(formatTBD), Column(dtCoarse, cols[c]) << getFormat);
addCol;
);
// ******************************************************************************************************
// The logic relies on the two tables being sorted in ascending order!
// ******************************************************************************************************
fineDT = Column(dtFine, "Date") << getValues;
coarseDT = Column(dtCoarse, "Date") << getValues;
if(
// No time in dtCoarse is later than the earliest time in dtFine, so insert values in the first row in the latter
Max(coarseDT) < Min(fineDT),
For(c=1, c<=NItems(cols), c++,
Column(dtFine, n+c)[1] = Column(dtCoarse, cols[c])[NRow(dtCoarse)];
),
// Else . . .
// pos will contain the positions of the rows in dtFine at which the values in dtCoarse should be inserted.
// (Note: If a value in pos is bigger than NRow(dtFine), no row is added to the latter and no error results).
pos = LocSorted(fineDT, coarseDT);
pos = pos + J(NRow(pos), 1, 1);
// Insert values in cells
For(p=1, p<=NRow(pos), p++,
For(c=1, c<=NItems(cols), c++,
Column(dtFine, n+c)[pos[p]] = Column(dtCoarse, cols[c])[p];
);
);
);
- Mark as New
- Bookmark
- Subscribe
- Mute
- Subscribe to RSS Feed
- Get Direct Link
- Report Inappropriate Content
Re: Joining tables with different levels of precision
I've dealt with a similar issue in monitoring various sensors in my home. I have 5 sensors throughout the house, which measure temp, humidity and illumination. They send measurements to a central hub (SmartThings) every 8 minutes unless the value has not changed from the previous value. I also have a continuous power meter, which measure power utilization in the house.
The way I've dealt with this problem is to build a "year of 5 minutes" JMP data table, which has samples every 5 minutes for a year. And then I interleave the values from my 20 sensors into this year of 5 minutes table using a script. So if I have a reading at that particular sample for a sensor it gets recorded, if not there is a missing value.
Year of 5 mins:
I have another script, which lets me visualize "sensor health" -- basically a "IsMissing" check. This lets me know when I have network issues, sensor problems etc. It's been very helpful. And also visualize if my join is working.
So basically the strategy was to employ a master sampling table at the shortest time interval I would have in my measurements (every minutes) and the Join each sensor to that master table.

- Mark as New
- Bookmark
- Subscribe
- Mute
- Subscribe to RSS Feed
- Get Direct Link
- Report Inappropriate Content
Re: Joining tables with different levels of precision
Hi Kennedy3,
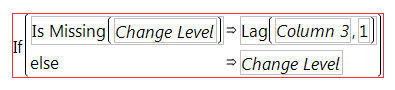
If you’re looking for a way to do this manually, the following approach (which can easily be scripted) should work for you. The formula below copies the value of “Change Level” down the new formula column until it bumps into a timestamp with a new “Change Level”.
Assumptions: Table 1 and Table 2 have the same column names for Date;
In the steps below, Table 1 has a column named “Change Level”
Step 1: Use Tables => Concatenate to append one table to the other
Step 2: Use Tables => Sort to sort the new table by Date
Step 3: Create a Formula column in the resulting table with the following formula:
(In the formula above, the new formula column is called “Column 3”)
If you don’t want to keep the information from Table 1 in the resulting table (i.e. if it’s just a “lookup” table), you could select all of the non-missing rows from the “Change Level” column and delete them.
Hope this helps…

- Mark as New
- Bookmark
- Subscribe
- Mute
- Subscribe to RSS Feed
- Get Direct Link
- Report Inappropriate Content
Re: Joining tables with different levels of precision
hi Kennedy3,
so far you got excellent answers with a wide perspective.
i will only add that once you get the data joint you may be interested in graphing it over time so take a look at this:
1) Expand by Frequency Column Add-In
2)bubble plots - unequal time intervals
ron
Recommended Articles
- © 2026 JMP Statistical Discovery LLC. All Rights Reserved.
- Terms of Use
- Privacy Statement
- Contact Us