- Don’t miss your chance to experience Discovery Summit Europe at our best available rate! Early bird registration through 31 Oct.
- Graph Builder Toolbar streamlines interactive graphing. Creates shortcuts on Report and GraphBuilder Helpers toolbars. Download and install the extension.
- Subscribe to RSS Feed
- Mark Topic as New
- Mark Topic as Read
- Float this Topic for Current User
- Bookmark
- Subscribe
- Mute
- Printer Friendly Page
Discussions
Solve problems, and share tips and tricks with other JMP users.- User Community
- :
- Discussions
- :
- JMP script formula to calculate the delta of multiple different ranges from X co...

- Mark as New
- Bookmark
- Subscribe
- Mute
- Subscribe to RSS Feed
- Get Direct Link
- Report Inappropriate Content
JMP script formula to calculate the delta of multiple different ranges from X coordinates of a .csv file and display on graph, or in a text box
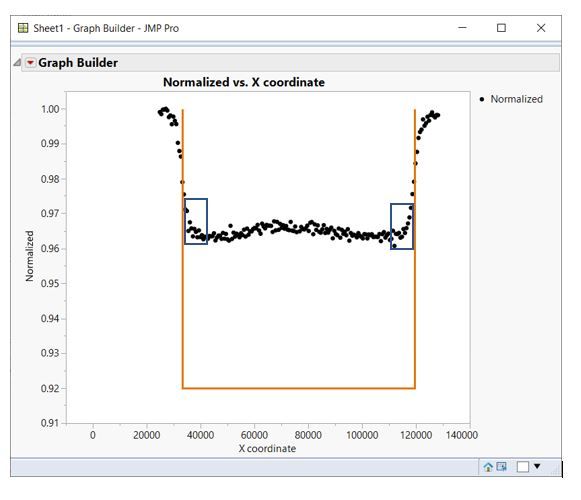
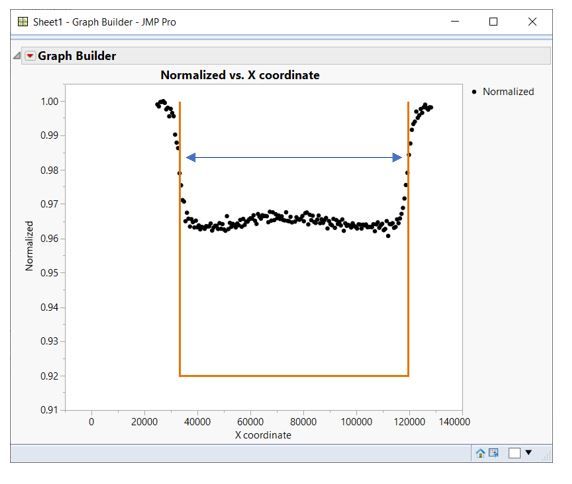
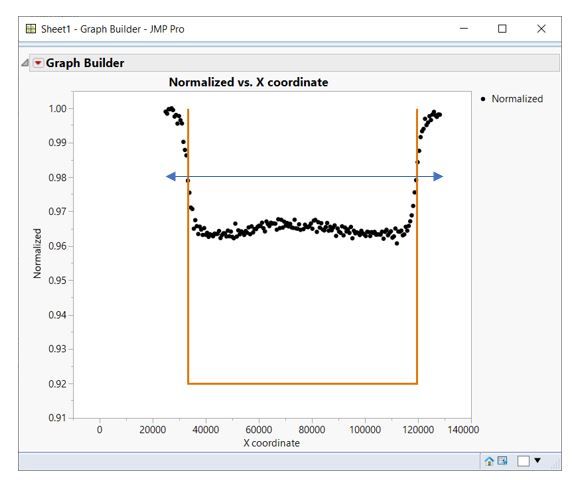
Hi, I have a script that creates the attached graph of some data points and overlays it with an additional line graph. I need to now be able to calculate the delta between the high and low points in multiple different x coordinates. I am able to do the first one since it includes all the x coordinate values, but I am stumped on how to do it for only the x coordinate values in-between the orange calculated lines, as well as only the only the initial curve on both the left and right side inside of the orange line calculations. Than I wanted to display these values on the graph if possible, or in a text box that is displayed when the graph is made. I have included some images that help to explain the 4 different ranges I need to calculate the delta from, as well as included my current script. The orange line may change depending on the data, since it is based off of a value that the user inputs when you run the script. Any assistance is greatly appreciated. Thanks!
framex_value = "";
w = New Window( "Frame size X",// opens a window with a title and this content...
		<<Return Result,
    Border Box( top( 20 ), bottom( 20 ), Left( 20 ), Right( 20 ), // window dressing
        V List Box( // V and H lists nest to organize the display boxes
            H Center Box( Text Box( "Frame size X" ) ), // a second title, centered
            Spacer Box( size( 1, 20 ) ), // a little vertical space
            H List Box( Text Box( "Frame size X: " ), framex = Number Edit Box( "." ) ), // data entry
            Spacer Box( size( 1, 10 ) ), // a little vertical space
            H Center Box( // center the button
                Button Box( "Create graph", // this script runs when the button is pressed...
                  framex_value = framex << get ;

                    column("X coordinate")<<data type(Numeric)<<Modeling Type(Continuous)<<Format(Best,12);
					New Column ( "New Y", Numeric, Nominal, Width( 5), Formula(Round(Y coordinate)));
					dt =Current Data Table();
					dt << select where( :New Y != 50503 );
					dt << delete rows;
					New Column ( "Normalized", Numeric, Continuous, Width( 10 ), Precision ( 7 ), Formula(IntenCD/Col Max(IntenCD)) );
					New Column ( "Delta" , Numeric, Continuous, Width( 10 ), Precision ( 7 ), Formula(Col Max(IntenCD)-(Col Min(IntenCD))));
					FullMat = matrix(Col Max(IntenCD)-(Col Min(IntenCD)));
					New Column ( "Normalized Field", Numeric, Continuous, Width( 10 ), Precision ( 7 ));

					//New Column ( "Normalized Field", Numeric, Continuous, Width( 10 ), Precision ( 7 ));
					//dt << select where( :X coordinate > (76200 - framex_value/2) & :X coordinate < (76200 - framex_value/2) );
					//dt << delete rows:
					//FieldMat = matrix(Col Max(IntenCD)-(Col Min(IntenCD)));

                    New Window( " Delta results: ", modal,
						Border Box( top( 20 ), bottom( 20 ), Left( 20 ), Right( 20 ), // window dressing
						V List Box( // V and H lists nest to organize the display boxes
						H List Box( Text Box( "Full plate delta: " ), TextBox( Char( FullMat ) ) ),
						//Spacer Box( size( 1, 10 ) ), // a little vertical space
						//H List Box( Text Box( "Full field delta: " ), TextBox( Char( FieldMat ) ) ),
						//Spacer Box( size( 1, 10 ) ), // a little vertical space
						//H List Box( Text Box( "Edge of field delta: " ), TextBox( Char( 0 ) ) ),
							))
						);

					// Determine X Matrix
					xMat = matrix(76200 - (framex_value/2)) |/ matrix(76200 - (framex_value/2)) |/
						matrix(76200 + (framex_value/2)) |/ matrix(76200 + (framex_value/2));
					// The yMat is static
					yMat = [1, 0.92, 0.92, 1];

					gb = dt << Graph Builder(
						Size( 534, 456 ),
						Show Control Panel( 0 ),
						Variables( X( :X Coordinate ), Y( :Normalized ) ),
						Elements( Points( X, Y, Legend( 5 ) ) )
					);

					Report( gb )[FrameBox( 1 )] << Add Graphics Script(
						Pen Color( "orange" );
						Pen Size( 2 );
						Line( xmat, ymat );
					);
					report(gb)[AxisBox(2)] << min(.91);

                    w << closeWindow; // just the dialog, not the report
                )
            )
        )
     )

);- Mark as New
- Bookmark
- Subscribe
- Mute
- Subscribe to RSS Feed
- Get Direct Link
- Report Inappropriate Content
Re: JMP script formula to calculate the delta of multiple different ranges from X coordinates of a .csv file and display on graph, or in a text box
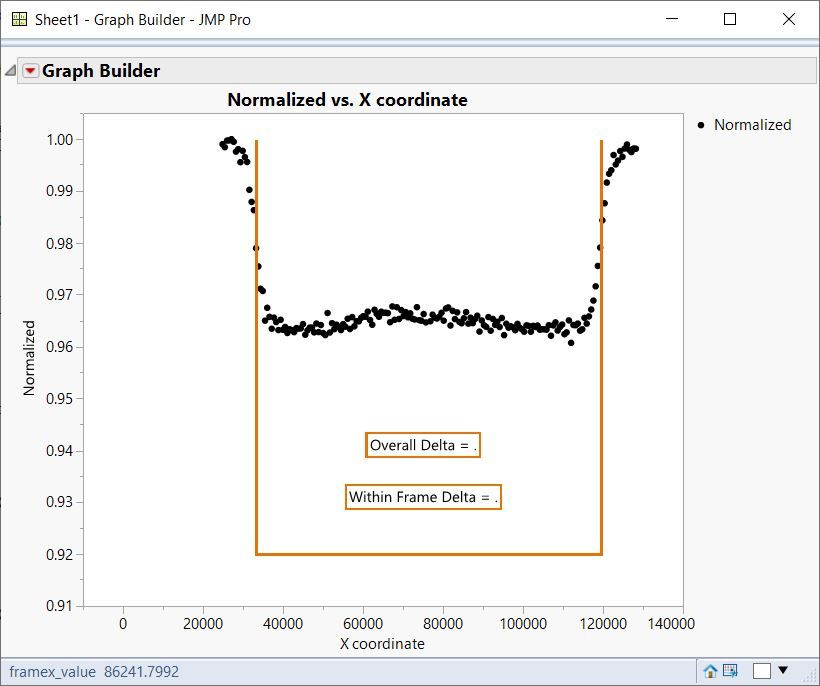
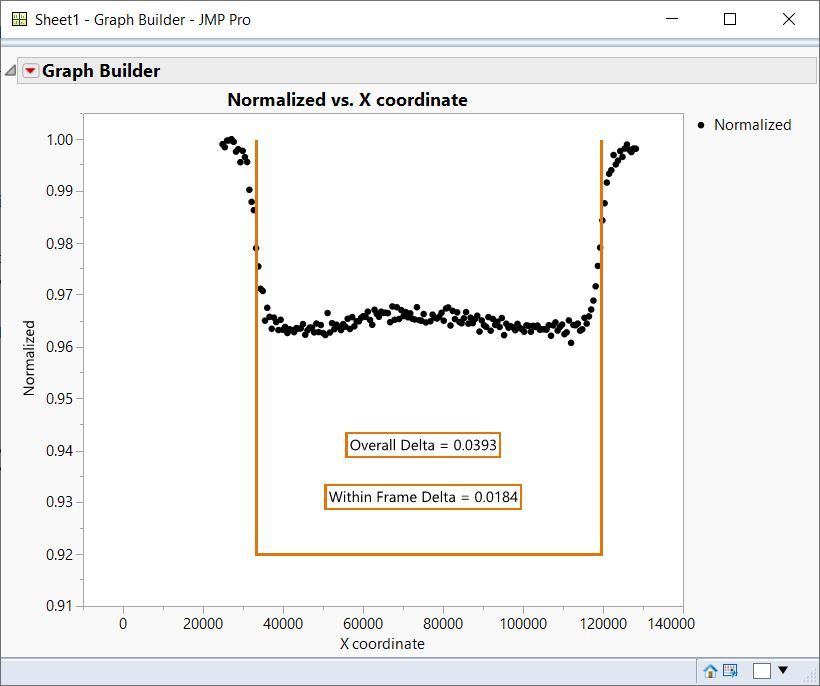
So after further testing with my script, it seems that it works perfect (the second time I run it on the data), but not the first time. After the first run it does not calculate and display the delta's, but the second time I run the script it does work...I'm confused. I have attached the cleaned up code, as well as a picture of the no results first run... and a picture of the successful results second run. What am I missing that is not causing my script to work correctly the first time?
framex_value = "";
w = New Window( "Frame size X",// opens a window with a title and this content...
		<<Return Result,
    Border Box( top( 20 ), bottom( 20 ), Left( 20 ), Right( 20 ), // window dressing
        V List Box( // V and H lists nest to organize the display boxes
            H Center Box( Text Box( "Frame size X" ) ), // a second title, centered
            Spacer Box( size( 1, 20 ) ), // a little vertical space
            H List Box( Text Box( "Frame size X: " ), framex = Number Edit Box( "." ) ), // data entry
            Spacer Box( size( 1, 10 ) ), // a little vertical space
            H Center Box( // center the button
                Button Box( "Create graph", // this script runs when the button is pressed...
                  framex_value = framex << get ;

                    column("X coordinate")<<data type(Numeric)<<Modeling Type(Continuous)<<Format(Best,12);
					New Column ( "New Y", Numeric, Nominal, Width( 5), Formula(Round(Y coordinate)));
					dt =Current Data Table();
					dt << select where( :New Y != 50503 );
					dt << delete rows;
					New Column ( "Normalized", Numeric, Continuous, Width( 10 ), Precision ( 7 ), Formula(IntenCD/Col Max(IntenCD)) );


					// Determine X Matrix
					xMat = matrix(76200 - (framex_value/2)) |/ matrix(76200 - (framex_value/2)) |/
						matrix(76200 + (framex_value/2)) |/ matrix(76200 + (framex_value/2));
					// The yMat is static
					yMat = [1, 0.92, 0.92, 1];

					// The overall delta
					overallDelta = Col Max( :Normalized ) - Col Min( :Normalized );


					//The delta between the lines
					withinOrangeDelta = Col Max(
						If( :X coordinate > (76200 - (framex_value / 2)) & :X coordinate < (76200 + (framex_value / 2)),
							:Normalized,
							.
						)
					) - Col Max( :Normalized ) - Col Min( :Normalized ) +1;
							Col Min(
						If( :X coordinate > (76200 - (framex_value / 2)) & :X coordinate < (76200 + (framex_value / 2)),
							:Normalized,
							.
						)
					);

								// Graph Builer and Delta display
								gb = dt << Graph Builder(
								Size( 534, 456 ),
								Show Control Panel( 0 ),
								Variables( X( :X Coordinate ), Y( :Normalized ) ),
								Elements( Points( X, Y, Legend( 5 ) ) )
							);

							Report( gb )[FrameBox( 1 )] << Add Graphics Script(
								Pen Color( "orange" );
								Pen Size( 2 );
								Line( xmat, ymat );

													// Add the results to the chart
								Text( Boxed, {75000, .94}, "Overall Delta = " || Char( Format( overallDelta, 7, 4 ) ) );
								Text( Boxed, {75000, .93}, "Within Frame Delta = " || Char( Format( withinOrangeDelta, 7, 4 ) ) );
							);
							Report( gb )[AxisBox( 2 )] << Min( .91 );

							w << closeWindow;

                )
            )
        )
     )

);


- Mark as New
- Bookmark
- Subscribe
- Mute
- Subscribe to RSS Feed
- Get Direct Link
- Report Inappropriate Content
Re: JMP script formula to calculate the delta of multiple different ranges from X coordinates of a .csv file and display on graph, or in a text box
by default, when JMP creates a variable, like your xMat etc. the variable will remain until it is changed. And, if on the first run of your code, the required variable hasn't been created, when you are asking for it in your code, it will not have a value to provide the program, and then some calculations will not be able to be run. However, if later in the script, the variable is set, it will remain set until deleted of changed. Therefore, when you run the script for a second time, and the code gets to the point where in the first run of the script, it could not find the required variable, this time it will find it, because it was set at a later time in the code during the last run of the script.
I found a possible place where this could have happened. You were setting the variable dt after activities on the data table were being done. I moved the line of code further up in the script, so that may get the code to work on a first run. I also placed a "Clear Symbols()" as the first line of the script. This will clear out all variables in the code as the script begins. This will ensure that the variable values referenced will have to have been created in this run of the code, since all of the values from the last run have been erased. Try the code and see if it works.
Clear Symbols();
Names Default To Here( 1 );

ramex_value = "";
w = New Window( "Frame size X", // opens a window with a title and this content...
	<<Return Result,
	Border Box( top( 20 ), bottom( 20 ), Left( 20 ), Right( 20 ), // window dressing
		V List Box( // V and H lists nest to organize the display boxes
			H Center Box( Text Box( "Frame size X" ) ), // a second title, centered
			Spacer Box( size( 1, 20 ) ), // a little vertical space
			H List Box( Text Box( "Frame size X: " ), framex = Number Edit Box( "." ) ), // data entry
			Spacer Box( size( 1, 10 ) ), // a little vertical space
			H Center Box( // center the button
				Button Box( "Create graph", // this script runs when the button is pressed...
					framex_value = framex << get;

					dt = Current Data Table();

					Column( dt, "X coordinate" ) << data type( Numeric ) << Modeling Type( Continuous ) << Format( Best, 12 );

					dt << New Column( "New Y", Numeric, Nominal, Width( 5 ), Formula( Round( Y coordinate ) ) );

					dt << select where( :New Y != 50503 );
					dt << delete rows;
					dt << New Column( "Normalized", Numeric, Continuous, Width( 10 ), Precision( 7 ), Formula( IntenCD / Col Max( IntenCD ) ) );


					// Determine X Matrix
					xMat = Matrix( 76200 - (framex_value / 2) ) |/ Matrix( 76200 - (framex_value / 2) ) |/ Matrix( 76200 + (framex_value / 2) ) |/
					Matrix( 76200 + (framex_value / 2) );
					// The yMat is static
					yMat = [1, 0.92, 0.92, 1];

					// The overall delta
					overallDelta = Col Max( dt:Normalized ) - Col Min( dt:Normalized );

					//The delta between the lines
					withinOrangeDelta = Col Max(
						If( dt:X coordinate > (76200 - (framex_value / 2)) & dt:X coordinate < (76200 + (framex_value / 2)),
							dt:Normalized,
							.
						)
					) - Col Max( dt:Normalized ) - Col Min( dt:Normalized ) + 1;
					Col Min( If( dt:X coordinate > (76200 - (framex_value / 2)) & dt:X coordinate < (76200 + (framex_value / 2)), dt:Normalized, . ) );

								// Graph Builer and Delta display
					gb = dt << Graph Builder(
						Size( 534, 456 ),
						Show Control Panel( 0 ),
						Variables( X( dt:X Coordinate ), Y( dt:Normalized ) ),
						Elements( Points( X, Y, Legend( 5 ) ) )
					);

					Report( gb )[FrameBox( 1 )] << Add Graphics Script(
						Pen Color( "orange" );
						Pen Size( 2 );
						Line( xmat, ymat );

													// Add the results to the chart
						Text( Boxed, {75000, .94}, "Overall Delta = " || Char( Format( overallDelta, 7, 4 ) ) );
						Text( Boxed, {75000, .93}, "Within Frame Delta = " || Char( Format( withinOrangeDelta, 7, 4 ) ) );
					);
					Report( gb )[AxisBox( 2 )] << Min( .91 );

					w << closeWindow;

				)
			)
		)
	)

);- Mark as New
- Bookmark
- Subscribe
- Mute
- Subscribe to RSS Feed
- Get Direct Link
- Report Inappropriate Content
Re: JMP script formula to calculate the delta of multiple different ranges from X coordinates of a .csv file and display on graph, or in a text box
Thanks @txnelson. I was able to get this figured out and it is working perfect. I found that I needed to put { } around the xy coordinates for the text to show up in the graph. I really appreciate all your knowledge and assistance with my script!
- Mark as New
- Bookmark
- Subscribe
- Mute
- Subscribe to RSS Feed
- Get Direct Link
- Report Inappropriate Content
Re: JMP script formula to calculate the delta of multiple different ranges from X coordinates of a .csv file and display on graph, or in a text box
Perfect, thanks @txnelson. These 2 changes did the trick. It is working perfect now. Thanks again for all the help with this!
- « Previous
-
- 1
- 2
- Next »
Recommended Articles
- © 2026 JMP Statistical Discovery LLC. All Rights Reserved.
- Terms of Use
- Privacy Statement
- Contact Us