- New to JMP? Join us Sept. 23-24 for the Early User Edition of Discovery Summit, tailor-made for new users. Register now for free!
- Use World Cup data to build models, explore spatial relationships, and create informative visualizations in JMP. Register. July 17, 2 pm US Eastern Time.
- Your voice matters! Tell us how you prefer to receive JMP updates, so we can tailor our communication to your needs. Take short survey.
- Subscribe to RSS Feed
- Mark Topic as New
- Mark Topic as Read
- Float this Topic for Current User
- Bookmark
- Subscribe
- Mute
- Printer Friendly Page
Discussions
Solve problems, and share tips and tricks with other JMP users.- JMP User Community
- :
- Discussions
- :
- Increasing level of contours on ternary plot

- Mark as New
- Bookmark
- Subscribe
- Mute
- Subscribe to RSS Feed
- Get Direct Link
- Report Inappropriate Content
Increasing level of contours on ternary plot
Hi all,
I need to use a ternary plot since I've run a mixture DOE with 3 variables, I can use my prediction formula to show on my ternary plot but it looks like its locked at 5 levels. I'd really like to have 6 or 7 levels. I don't see the options typical in graph builder or when doing a contour plot. Anyway do increase levels on a ternary plot? Thanks in advance!
I'm using JMP 17.0.0

- Mark as New
- Bookmark
- Subscribe
- Mute
- Subscribe to RSS Feed
- Get Direct Link
- Report Inappropriate Content
Re: Increasing level of contours on ternary plot
You are correct, The Ternary Plot provides only five levels for contours. The Mixture Profile provides a variable number of contour lines. Click the red triangle and select Countour Grid. You then specify the minimum, maximum, and increment for the lines.

- Mark as New
- Bookmark
- Subscribe
- Mute
- Subscribe to RSS Feed
- Get Direct Link
- Report Inappropriate Content
Re: Increasing level of contours on ternary plot
Hi Mark,
Thank you for the response. Is there anyway to color in the mixture plot for different contours like in the ternary plot? I'd like to use these for a poster with the goal that someone not familiar with JMP could understand. The contours on the ternary plot essentially make a heat map that is easy for anyone to quickly understand, the mixture contours just as line, not so much. A couple of my steps really need that 6/7 levels of color to showcase what we're trying to do. Also open to others way to show the results from a mixture DOE in an easy to understand way. Thanks again for the help!

- Mark as New
- Bookmark
- Subscribe
- Mute
- Subscribe to RSS Feed
- Get Direct Link
- Report Inappropriate Content
Re: Increasing level of contours on ternary plot
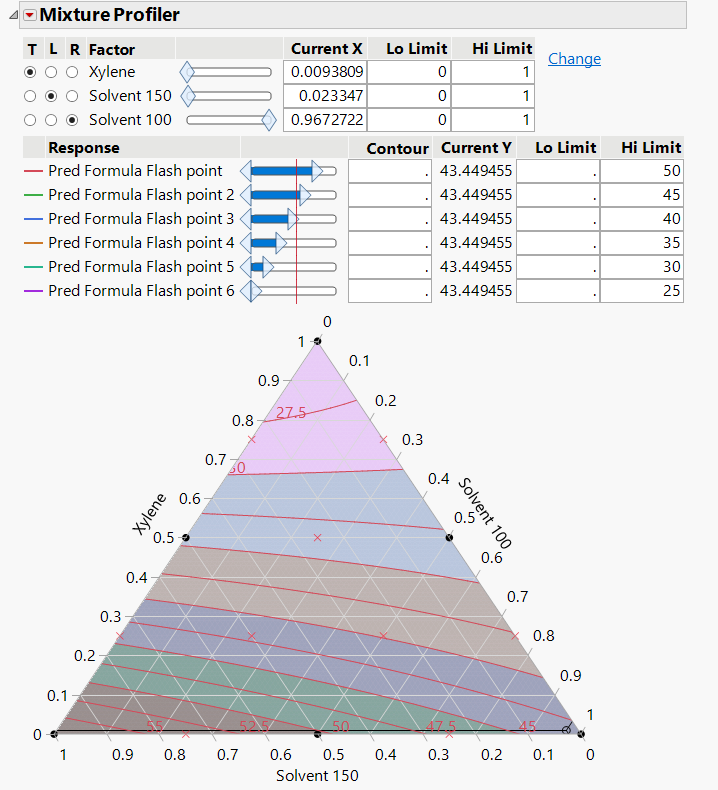
One option with the mixture profiler would be to generate several identical prediction formula columns (equal to however many levels you want to show in the ternary plot) and then add different high or low level limits as shown below.
Unfortunately the colors become a bit muted due to the overlay of the different colors, but perhaps someone can identify a way of avoiding this.

Recommended Articles
- © 2026 JMP Statistical Discovery LLC. All Rights Reserved.
- Terms of Use
- Privacy Statement
- Contact Us