- New to JMP? Join us Sept. 23-24 for the Early User Edition of Discovery Summit, tailor-made for new users. Register now for free!
- Your voice matters! Tell us how you prefer to receive JMP updates, so we can tailor our communication to your needs. Take short survey.
- See how to access JMP Marketplace - and - find, create & share add-ins to extend your JMP. Watch video.
- Subscribe to RSS Feed
- Mark Topic as New
- Mark Topic as Read
- Float this Topic for Current User
- Bookmark
- Subscribe
- Mute
- Printer Friendly Page
Discussions
Solve problems, and share tips and tricks with other JMP users.- JMP User Community
- :
- Discussions
- :
- How to move the labels inside the picture?

- Mark as New
- Bookmark
- Subscribe
- Mute
- Subscribe to RSS Feed
- Get Direct Link
- Report Inappropriate Content
How to move the labels inside the picture?
How to move the labels inside the picture (see picture)? Thank you in advance!

Accepted Solutions

- Mark as New
- Bookmark
- Subscribe
- Mute
- Subscribe to RSS Feed
- Get Direct Link
- Report Inappropriate Content
Re: How to move the labels inside the picture?
Hi Ted
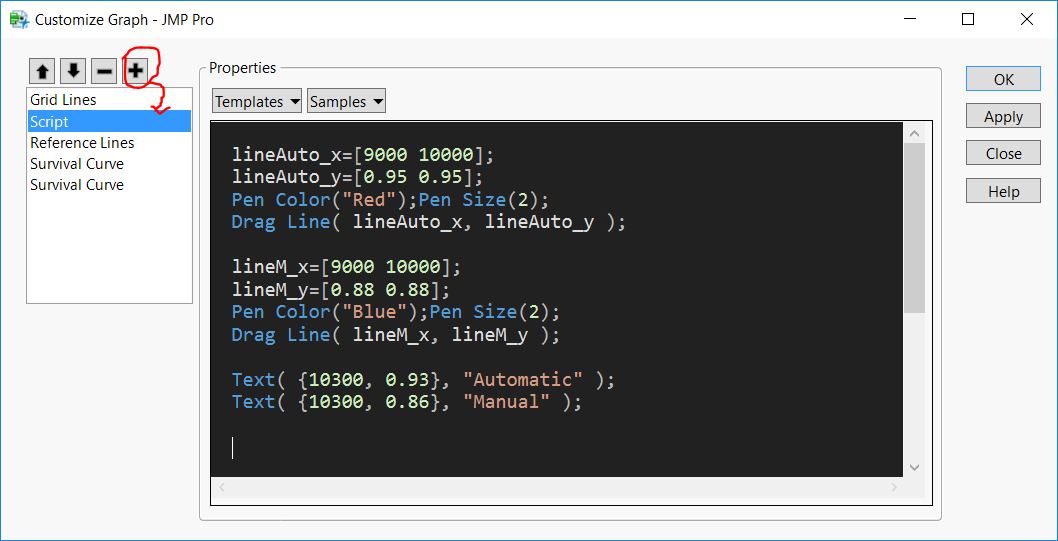
No option in 'Red triangle' or somewhere in survival platform. My solution is add customer graph.
Sample data used 'Blenders', function 'survival'. Add JSL in customerize window.(See picture).
Hope it can help to solve your problem.
Attach JSL as below.
lineAuto_x=[9000 10000];
lineAuto_y=[0.95 0.95];
Pen Color("Red");Pen Size(2);
Drag Line( lineAuto_x, lineAuto_y );

lineM_x=[9000 10000];
lineM_y=[0.88 0.88];
Pen Color("Blue");Pen Size(2);
Drag Line( lineM_x, lineM_y );

Text( {10300, 0.93}, "Automatic" );
Text( {10300, 0.86}, "Manual" );
- Mark as New
- Bookmark
- Subscribe
- Mute
- Subscribe to RSS Feed
- Get Direct Link
- Report Inappropriate Content
Re: How to move the labels inside the picture?
Make Legend floating:

and then you can drag and drop it

Edit: seems like you can just start drag and dropping without first changing the legend position.
- Mark as New
- Bookmark
- Subscribe
- Mute
- Subscribe to RSS Feed
- Get Direct Link
- Report Inappropriate Content
Re: How to move the labels inside the picture?
Thanks, but my figure built here: Analyze->Realibility and Survival->Survival.
(Graph Builder does not build survival curves)
- Mark as New
- Bookmark
- Subscribe
- Mute
- Subscribe to RSS Feed
- Get Direct Link
- Report Inappropriate Content
Re: How to move the labels inside the picture?
Hi Ted
No option in 'Red triangle' or somewhere in survival platform. My solution is add customer graph.
Sample data used 'Blenders', function 'survival'. Add JSL in customerize window.(See picture).
Hope it can help to solve your problem.
Attach JSL as below.
lineAuto_x=[9000 10000];
lineAuto_y=[0.95 0.95];
Pen Color("Red");Pen Size(2);
Drag Line( lineAuto_x, lineAuto_y );

lineM_x=[9000 10000];
lineM_y=[0.88 0.88];
Pen Color("Blue");Pen Size(2);
Drag Line( lineM_x, lineM_y );

Text( {10300, 0.93}, "Automatic" );
Text( {10300, 0.86}, "Manual" );Recommended Articles
- © 2026 JMP Statistical Discovery LLC. All Rights Reserved.
- Terms of Use
- Privacy Statement
- Contact Us