- New to JMP? Join us Sept. 23-24 for the Early User Edition of Discovery Summit, tailor-made for new users. Register now for free!
- Your voice matters! Tell us how you prefer to receive JMP updates, so we can tailor our communication to your needs. Take short survey.
- See how to access JMP Marketplace - and - find, create & share add-ins to extend your JMP. Watch video.
- Subscribe to RSS Feed
- Mark Topic as New
- Mark Topic as Read
- Float this Topic for Current User
- Bookmark
- Subscribe
- Mute
- Printer Friendly Page
Discussions
Solve problems, and share tips and tricks with other JMP users.- JMP User Community
- :
- Discussions
- :
- How to manipulate axes scales in Graph Builder when using log units

- Mark as New
- Bookmark
- Subscribe
- Mute
- Subscribe to RSS Feed
- Get Direct Link
- Report Inappropriate Content
How to manipulate axes scales in Graph Builder when using log units
Hello,
Please see attached data file.
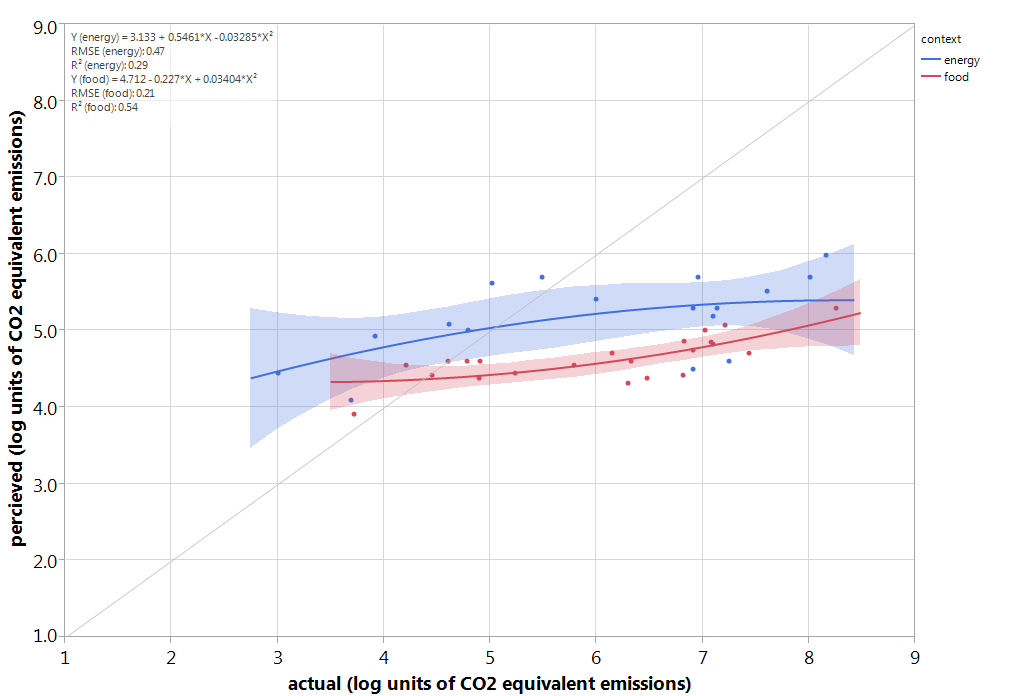
I am trying to plot "actual" vs. "perceived" separated by "context". I have created a graph doing this and saved the script as "Graph - Perceived ~ Actual x Context".
(1.png)
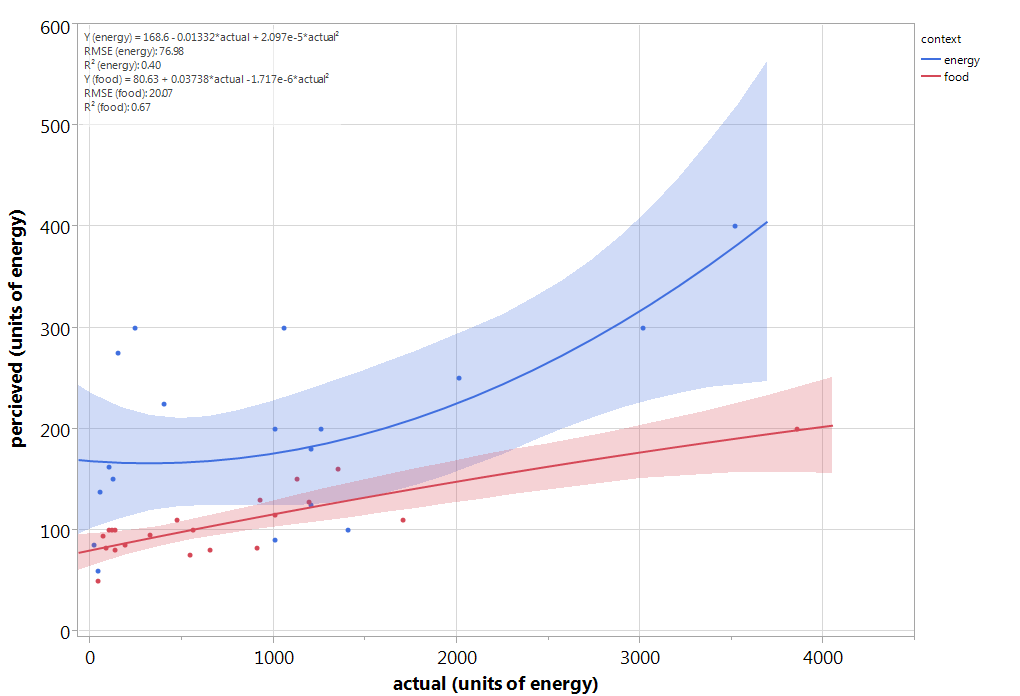
The data is skewed so I created via the formula function two new variable by logging both "actual" vs. "perceived". I then created a new graph and saved the script as " Graph - Ln(Perceived ) ~ Ln(Actual) x Context".
(2.png)
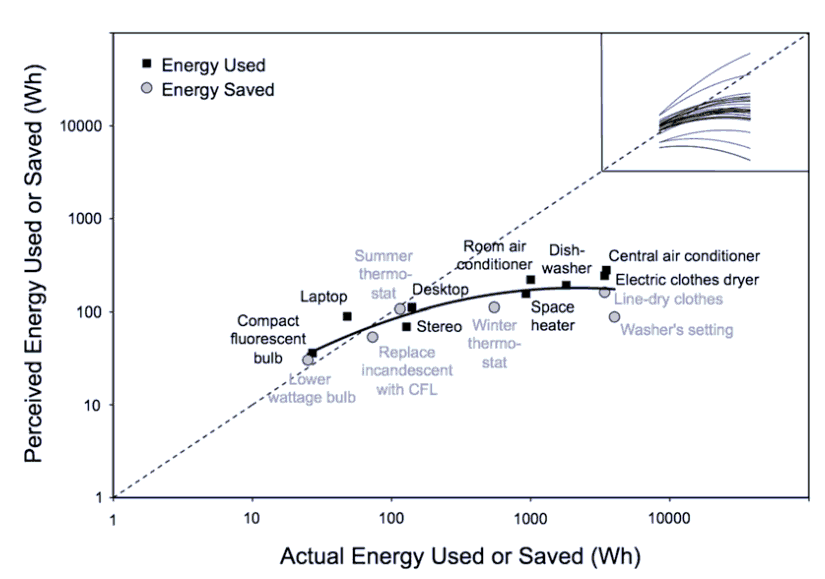
This new figure gives me the shape I want but the axes are not interpretable. How do I create axes that operate on the original raw numbers and create a graph that has axes like the following:
(3.png)
Basically, how do I draw a figure that logs the data of the x and y axes but presents the data in the original units, rather than log units?
Thanks.
Adrian
Accepted Solutions

- Mark as New
- Bookmark
- Subscribe
- Mute
- Subscribe to RSS Feed
- Get Direct Link
- Report Inappropriate Content
Re: How to manipulate axes scales in Graph Builder when using log units
Make the plot with untransformed data and dubbelclick on an axis to bring up the axis specification dialog and change the scale setting from linear to log.
- Mark as New
- Bookmark
- Subscribe
- Mute
- Subscribe to RSS Feed
- Get Direct Link
- Report Inappropriate Content
Re: How to manipulate axes scales in Graph Builder when using log units
Also:
analyze -> fit Y by X
perceived = Y
actual = X
Click OK
red triangle -> group by -> context
red triangle -> fit special
Change Y transformation to natural log
Change X transformation to natural log
Change degree from 1 Linear to 2 Quadratic
Click OK
Double click the Y axis and change the scale from linear to log Double click the X axis and change the scale from linear to log
Recommended Articles
- © 2026 JMP Statistical Discovery LLC. All Rights Reserved.
- Terms of Use
- Privacy Statement
- Contact Us