Turn on suggestions
Auto-suggest helps you quickly narrow down your search results by suggesting possible matches as you type.
- Discovery Summit 2026: Early User Edition - September 23-24.Register. It's free.
- Graph Builder Toolbar streamlines interactive graphing. Creates shortcuts on Report and GraphBuilder Helpers toolbars. Download and install the extension.
Options
- Subscribe to RSS Feed
- Mark Topic as New
- Mark Topic as Read
- Float this Topic for Current User
- Bookmark
- Subscribe
- Mute
- Printer Friendly Page
Discussions
Solve problems, and share tips and tricks with other JMP users.- User Community
- :
- Discussions
- :
- Re: How to draw a trapezoid inside Fit Y by X chart or graph builder?

Level V
- Mark as New
- Bookmark
- Subscribe
- Mute
- Subscribe to RSS Feed
- Get Direct Link
- Report Inappropriate Content
How to draw a trapezoid inside Fit Y by X chart or graph builder?
Created:
Apr 18, 2021 09:32 AM
| Last Modified: Jun 11, 2023 4:13 AM
(3380 views)
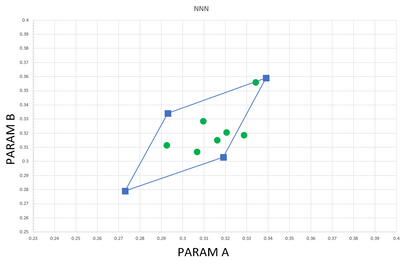
I am looking a way to draw a trapezoid limit inside Fit Y by X chart or graph builder like excel example below. Any idea?
4 REPLIES 4


Super User
- Mark as New
- Bookmark
- Subscribe
- Mute
- Subscribe to RSS Feed
- Get Direct Link
- Report Inappropriate Content
Re: How to draw a trapezoid inside Fit Y by X chart or graph builder?
Created:
Apr 18, 2021 10:22 AM
| Last Modified: Apr 18, 2021 9:27 AM
(3369 views)
| Posted in reply to message from OneNorthJMP 04-18-2021
Sorry, I do not know off hand, so I'll let others chime in. What is the criteria you want to use to create the trapezoid? Why do you want this?
"All models are wrong, some are useful" G.E.P. Box

Super User
- Mark as New
- Bookmark
- Subscribe
- Mute
- Subscribe to RSS Feed
- Get Direct Link
- Report Inappropriate Content
Re: How to draw a trapezoid inside Fit Y by X chart or graph builder?
Hi,
Could you confirm that you are looking for a method to calculate the anchor points of your trapezoid and not just a method to draw the trapezoid which can be easily done with the Polygon () function? If it is the case, what are the criteria for the desired dimensions of your trapezoid (i.e. anchor point positions)?
Best,
TS
Could you confirm that you are looking for a method to calculate the anchor points of your trapezoid and not just a method to draw the trapezoid which can be easily done with the Polygon () function? If it is the case, what are the criteria for the desired dimensions of your trapezoid (i.e. anchor point positions)?
Best,
TS
Thierry R. Sornasse

Super User
- Mark as New
- Bookmark
- Subscribe
- Mute
- Subscribe to RSS Feed
- Get Direct Link
- Report Inappropriate Content
Re: How to draw a trapezoid inside Fit Y by X chart or graph builder?
Created:
Apr 18, 2021 12:13 PM
| Last Modified: Apr 18, 2021 9:16 AM
(3353 views)
| Posted in reply to message from OneNorthJMP 04-18-2021
If you right click on the graph, you can Customize the graph, which will allow you to add the graphics you want to the chart.
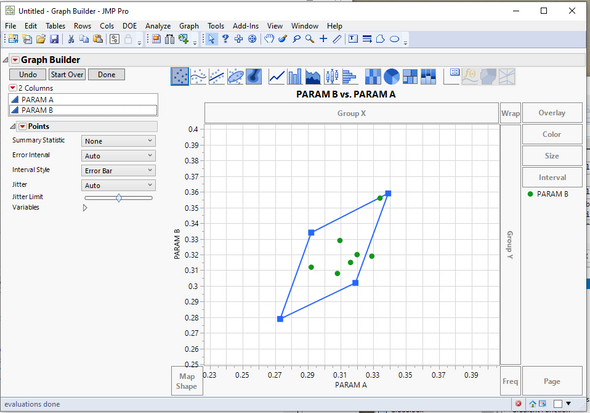
Here is what the customization window looks like
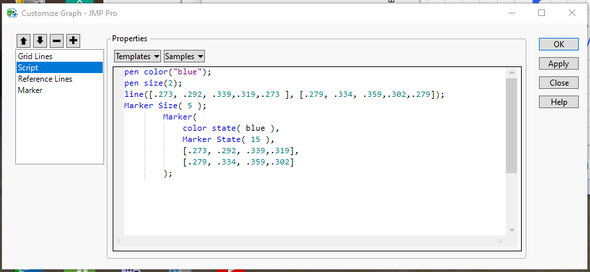
And here is the simple graphic code required
pen color("blue");
pen size(2);
line([.273, .292, .339,.319,.273 ], [.279, .334, .359,.302,.279]);
Marker Size( 5 );
		Marker(
			color state( blue ),
			Marker State( 15 ),
			[.273, .292, .339,.319],
			[.279, .334, .359,.302]
		);
Jim

Level III
- Mark as New
- Bookmark
- Subscribe
- Mute
- Subscribe to RSS Feed
- Get Direct Link
- Report Inappropriate Content
Re: How to draw a trapezoid inside Fit Y by X chart or graph builder?
@OneNorthJMP, Perhaps you will find what you are looking for in the Scripting Index, under the Help menu, by searching Polygon. You should be able to combine what you see under polygon in the scripting index with graph builder by right clicking in the graph space and selecting customize, then clicking the + symbol in the dialog that appears, to add a custom script (polygon()).
Hope this helps.
Hope this helps.
Recommended Articles
- © 2026 JMP Statistical Discovery LLC. All Rights Reserved.
- Terms of Use
- Privacy Statement
- Contact Us