- JMP Statement Regarding Critical PHP Remote Code Execution Vulnerabilities (CVE-2026-109618, CVE-2026-109619)
- Don’t miss your chance to experience Discovery Summit Europe at our best available rate! Early bird registration through 31 Oct.
- Graph Builder Toolbar streamlines interactive graphing. Creates shortcuts on Report and GraphBuilder Helpers toolbars. Download and install the extension.
- Subscribe to RSS Feed
- Mark Topic as New
- Mark Topic as Read
- Float this Topic for Current User
- Bookmark
- Subscribe
- Mute
- Printer Friendly Page
Discussions
Solve problems, and share tips and tricks with other JMP users.- User Community
- :
- Discussions
- :
- Re: How to add Summary Statistics for different X-axis nominal variables

- Mark as New
- Bookmark
- Subscribe
- Mute
- Subscribe to RSS Feed
- Get Direct Link
- Report Inappropriate Content
How to add Summary Statistics for different X-axis nominal variables
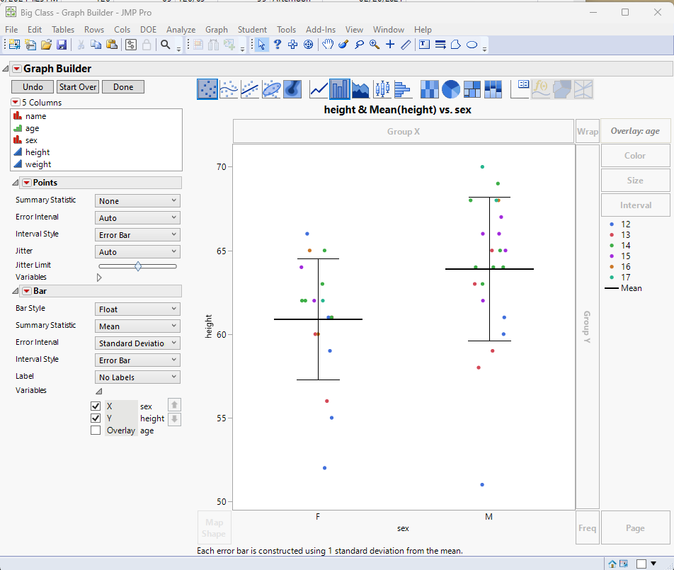
I have a large database which is formed of multiple experiments which can be separated by the scale of the experiment. I have created a scatter graph in graph builder with scale on the x-axis (a nominal variable with two values) and yield on the y-axis (continuous) with a overlay of experiment (as each experiment has repeats so there are multiple of each). Is there a way to add a summary statistics of mean with error bars of standard deviation for each scale (so one line for the small scale and one for the larger scale)? I tried before but loads of lines appeared because it presented the summary stats for each experiment and its repeats individually.
Additionally, I have a column switcher to change the y-axis to the other variables I have measured and would want the mean/SD statistic to still be present and update depending on my current column selected.
Is there a way to do this? Thank you in advance.
Accepted Solutions


- Mark as New
- Bookmark
- Subscribe
- Mute
- Subscribe to RSS Feed
- Get Direct Link
- Report Inappropriate Content
Re: How to add Summary Statistics for different X-axis nominal variables
- Mark as New
- Bookmark
- Subscribe
- Mute
- Subscribe to RSS Feed
- Get Direct Link
- Report Inappropriate Content
Re: How to add Summary Statistics for different X-axis nominal variables
Is this what you want?
- Mark as New
- Bookmark
- Subscribe
- Mute
- Subscribe to RSS Feed
- Get Direct Link
- Report Inappropriate Content
Re: How to add Summary Statistics for different X-axis nominal variables
Hi Jim. Yes this is what I wanted. I followed your image to add the bars and select the correct variables. Thank you
Recommended Articles
- © 2026 JMP Statistical Discovery LLC. All Rights Reserved.
- Terms of Use
- Privacy Statement
- Contact Us