- New to JMP? Join us Sept. 23-24 for the Early User Edition of Discovery Summit, tailor-made for new users. Register now for free!
- Use World Cup data to build models, explore spatial relationships, and create informative visualizations in JMP. Register. July 17, 2 pm US Eastern Time.
- Your voice matters! Tell us how you prefer to receive JMP updates, so we can tailor our communication to your needs. Take short survey.
- Subscribe to RSS Feed
- Mark Topic as New
- Mark Topic as Read
- Float this Topic for Current User
- Bookmark
- Subscribe
- Mute
- Printer Friendly Page
Discussions
Solve problems, and share tips and tricks with other JMP users.- JMP User Community
- :
- Discussions
- :
- How do I get side by side boxplots with two Y axis?

- Mark as New
- Bookmark
- Subscribe
- Mute
- Subscribe to RSS Feed
- Get Direct Link
- Report Inappropriate Content
How do I get side by side boxplots with two Y axis?
Hey,
I am trying to get side-by-side Boxplots in the graph builder using a dual Y-axis with different scales. I managed to create the two axis and create the plots, but they overlay each other. I would like them to be next to each other. I am using jmp 16.
Would appreciate any help given,
Itai
Accepted Solutions

- Mark as New
- Bookmark
- Subscribe
- Mute
- Subscribe to RSS Feed
- Get Direct Link
- Report Inappropriate Content
Re: How do I get side by side boxplots with two Y axis?
Welcome to the Community.
Here is how I have been able to solve your issue.

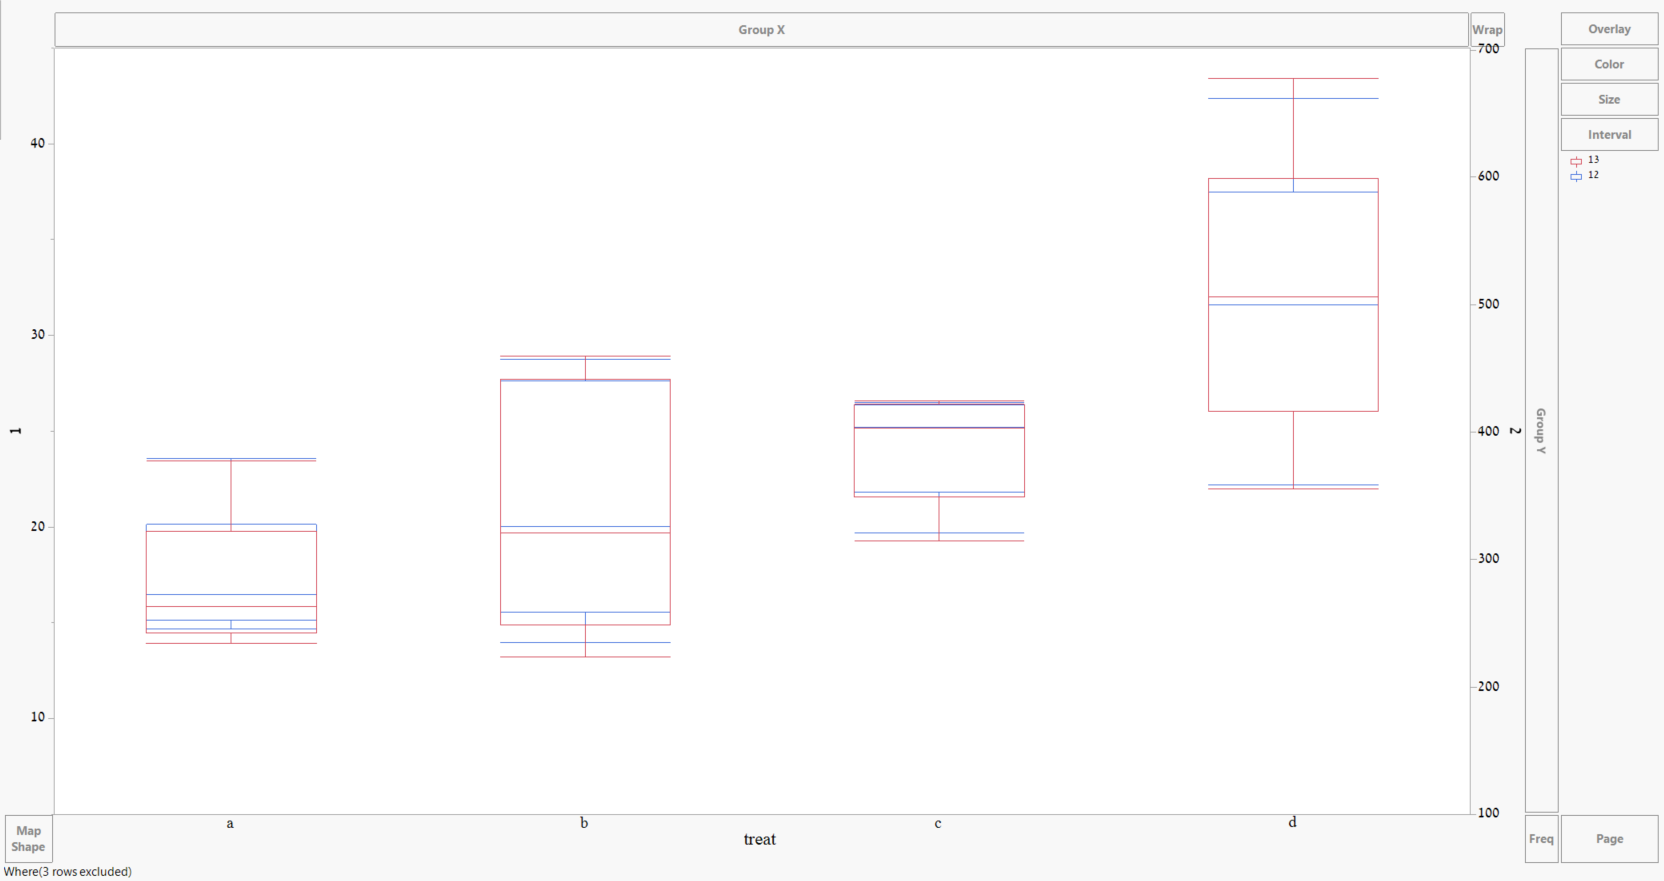
The answer lies in being able to have a column that can be used as an overlay column, which will separate displays of the Height and Weight values. In your example, it would be separating the 12 and 13 columns. To accomplish this, I duplicated all of the rows in my data table, separating the Height and Weight values onto one copy of the rows and then added a new column called "Column" that indicated which rows had the Height values present and which had the Weight values present.

Then it just became a simple matter of dragging the Height and Weight values to the Y axis, Right clicking on the Y axis and selecting "Move Right" to move the Weight axis to the right hand side. Then dragging the X column to the X axis, and the new column called "Column" to the Overlay drop area.
- Mark as New
- Bookmark
- Subscribe
- Mute
- Subscribe to RSS Feed
- Get Direct Link
- Report Inappropriate Content
Re: How do I get side by side boxplots with two Y axis?
Welcome to the Community.
Here is how I have been able to solve your issue.
The answer lies in being able to have a column that can be used as an overlay column, which will separate displays of the Height and Weight values. In your example, it would be separating the 12 and 13 columns. To accomplish this, I duplicated all of the rows in my data table, separating the Height and Weight values onto one copy of the rows and then added a new column called "Column" that indicated which rows had the Height values present and which had the Weight values present.
Then it just became a simple matter of dragging the Height and Weight values to the Y axis, Right clicking on the Y axis and selecting "Move Right" to move the Weight axis to the right hand side. Then dragging the X column to the X axis, and the new column called "Column" to the Overlay drop area.
- Mark as New
- Bookmark
- Subscribe
- Mute
- Subscribe to RSS Feed
- Get Direct Link
- Report Inappropriate Content
Re: How do I get side by side boxplots with two Y axis?
Thank you very much!
This is exactly what I wanted. I appreciate your help
Recommended Articles
- © 2026 JMP Statistical Discovery LLC. All Rights Reserved.
- Terms of Use
- Privacy Statement
- Contact Us