- Instantly extract effect sizes, F-ratios, and FDR-adjusted p-values from your models with the Calculate Effects Sizes extension, available now in the JMP Marketplace!
- New to JMP? Join us Sept. 23-24 for the Early User Edition of Discovery Summit, tailor-made for new users. Register now for free!
- Your voice matters! Tell us how you prefer to receive JMP updates, so we can tailor our communication to your needs. Take short survey.
- Subscribe to RSS Feed
- Mark Topic as New
- Mark Topic as Read
- Float this Topic for Current User
- Bookmark
- Subscribe
- Mute
- Printer Friendly Page
Discussions
Solve problems, and share tips and tricks with other JMP users.- JMP User Community
- :
- Discussions
- :
- Re: How do I get a gradient background in graph builder

- Mark as New
- Bookmark
- Subscribe
- Mute
- Subscribe to RSS Feed
- Get Direct Link
- Report Inappropriate Content
How do I get a gradient background in graph builder
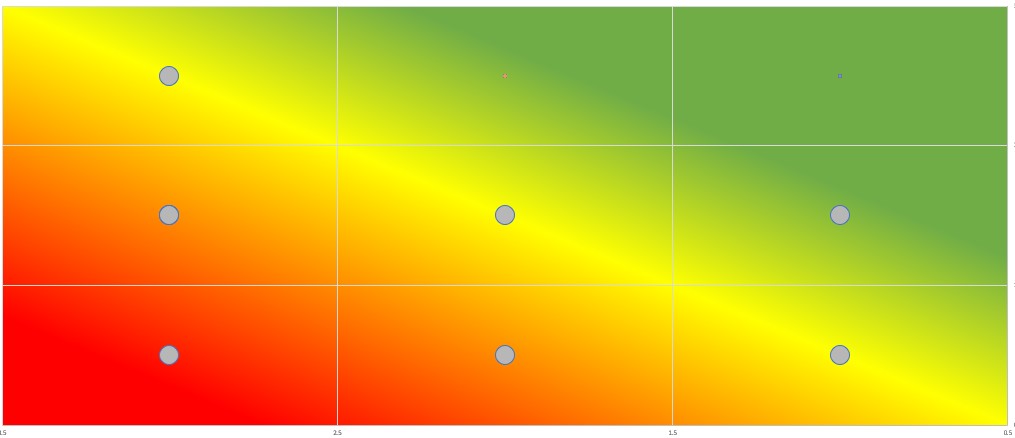
I want to create a scatter plot with 9 squares that looks like a McKinsey GE matrix, and plot data points in those squares. If the bottom left equals the lowest values and top right the highest value, I would like to have a gradient diagonal background, starting with red in the lower left corner and green in the top right with a yellow band in the middle (see attached jpg). In excel I can do this in a scatter plot. How do I create this background in graph builder?

- Mark as New
- Bookmark
- Subscribe
- Mute
- Subscribe to RSS Feed
- Get Direct Link
- Report Inappropriate Content
Re: How do I get a gradient background in graph builder
I was able to add the gradient as a background image, and then overlayed data on top of it. I am using the .jpg that you supplied. You would need to create a separate image. I believe that it could be build using a graph box() in JMP.

Here is the JSL
Names Default To Here( 1 );
dt = New Table( "example",
	Add Rows( 7 ),
	New Column( "x",
		Numeric,
		"Continuous",
		Format( "Best", 12 ),
		Set Values( [0.655, 0.655, 0.655, 1.69, 1.69, 2.715, 2.715] ),
		Set Display Width( 38 )
	),
	New Column( "y",
		Numeric,
		"Continuous",
		Format( "Best", 12 ),
		Set Values( [9.65, 5.6, 1.52, 5.6, 1.52, 5.6, 1.52] ),
		Set Display Width( 72 )
	),
	New Column( "size",
		Numeric,
		"Continuous",
		Format( "Best", 12 ),
		Set Values( [20, 20, 20, 20, 20, 20, 20] )
	),
	Set Row States( [8192, 8384, 8384, 8384, 8384, 8384, 8384] )
);

op = Graph Builder(
	Size( 1120, 456 ),
	Show Control Panel( 0 ),
	Variables( X( :x ), Y( :y ), Size( :size ) ),
	Elements( Points( X, Y, Legend( 7 ) ) ),
	SendToReport(
		Dispatch( {}, "x", ScaleBox, {Min( 0.15 ), Max( 3.2 ), Inc( 0.5 ), Minor Ticks( 1 )} ),
		Dispatch(
			{},
			"y",
			ScaleBox,
			{Min( -0.635918367346939 ), Max( 11.6721345272803 ), Inc( 2 ), Minor Ticks( 1 )}
		),
		Dispatch( {}, "400", LegendBox, {Legend Position( {7, [-1, -1]} )} )
	)
);
opr1 = op << report;
opr2 = opr1 << Clone Box;
opr1 << append( opr2 );
fb1 = opr1[Frame Box( 1 )];
fb1 << Add Image(
	Open( Convert File Path( "<path to the image>.jpg" ) ),
	Transparency( 0.9 ),
	Bounds(
		Left( 0.135416666666667 ),
		Right( 3.26041666666667 ),
		Top( 11.8333333333333 ),
		Bottom( -1 )
	),
	SetSize( {300, 210} )
);
fb1 << Copy Picture;
fb2 = opr2[Frame Box( 1 )];
fb2 << Paste Background Image;- Mark as New
- Bookmark
- Subscribe
- Mute
- Subscribe to RSS Feed
- Get Direct Link
- Report Inappropriate Content
Re: How do I get a gradient background in graph builder
Thanks Jim,
Apparently a bit more complex than excel.
Marc
Recommended Articles
- © 2026 JMP Statistical Discovery LLC. All Rights Reserved.
- Terms of Use
- Privacy Statement
- Contact Us