- New to JMP? Join us Sept. 23-24 for the Early User Edition of Discovery Summit, tailor-made for new users. Register now for free!
- Your voice matters! Tell us how you prefer to receive JMP updates, so we can tailor our communication to your needs. Take short survey.
- See how to access JMP Marketplace - and - find, create & share add-ins to extend your JMP. Watch video.
- Subscribe to RSS Feed
- Mark Topic as New
- Mark Topic as Read
- Float this Topic for Current User
- Bookmark
- Subscribe
- Mute
- Printer Friendly Page
Discussions
Solve problems, and share tips and tricks with other JMP users.- JMP User Community
- :
- Discussions
- :
- Re: How do I determine statistical difference in slopes with non-normal data

- Mark as New
- Bookmark
- Subscribe
- Mute
- Subscribe to RSS Feed
- Get Direct Link
- Report Inappropriate Content
How do I determine statistical difference in slopes with non-normal data
Greeting JMP Community,
I am currently working with a dataset containing a linear responses (r2 ranges from 0.86 to 0.99) of contaminant load in terms of the age of 6 indivuals with sampling over their entire lifetime (lifespans ranging from 2 years to 30+). 4 of the 6 individuals resided in the same region. I plotted the distributions using Log(10), ln, and centered data but I am unable to get a normal distribution for either age or load. Is there a suggested transformation or test to determine if the slopes are statistically different between the 6 individuals and between regions?
I found a post by staff a member suggesting indicator-variable regression with interaction is used to compare slopes of multiple linear fits but I am unsure if this test works with non-normal data. Additonally, the slopes range from 3 to ~500 so I could not use ANCOVA as the slopes are not homogenous. I look forward to hearing from the community and would appreciate any help.
Thanks,
ZW
Accepted Solutions

- Mark as New
- Bookmark
- Subscribe
- Mute
- Subscribe to RSS Feed
- Get Direct Link
- Report Inappropriate Content
Re: How do I determine statistical difference in slopes with non-normal data
Why is normality of the distributions important? The assumption of normality in a regression model is that the conditional Y distribution is normal, not the observed Y or X. You can use the residual plots from regression in the case of normal errors in the response.
Your data set should include Load (Y), Age (X), and Individual (X). The Load and Age should be continuous numeric data. The Individual should be nominal, but you can use a numeric or character value.
You question is about the statistical difference in the slopes. That goal is exactly what the ANCOVA model is intended for. The model terms should be Age, Individual, and Age*Individual. The last crossed term will test the significance of the different slopes and allow you to model the individual differences (e.g., Prediction Profiler).
- Mark as New
- Bookmark
- Subscribe
- Mute
- Subscribe to RSS Feed
- Get Direct Link
- Report Inappropriate Content
Re: How do I determine statistical difference in slopes with non-normal data
Mark Bailey,
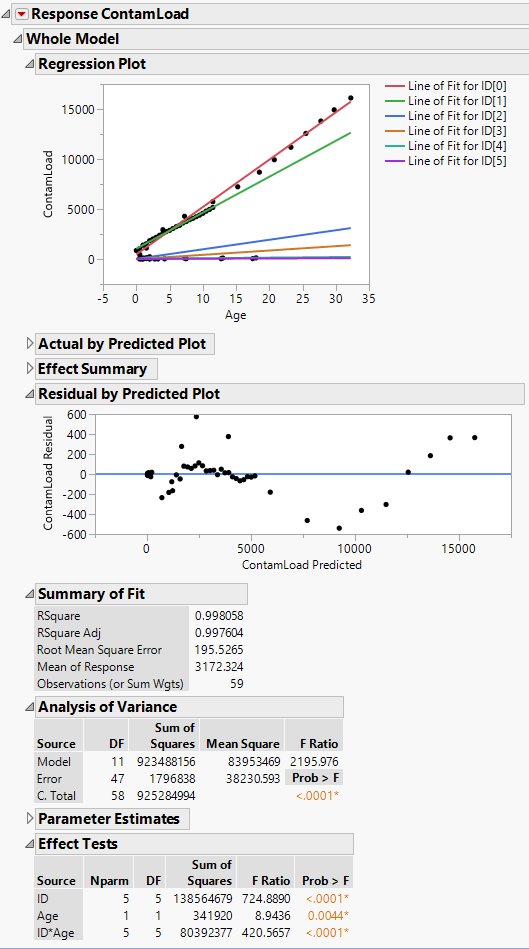
Thank you for the quick response and for clarifying the observed Y or X do not have to be normal. I have included the output using your suggestions and found that the Individual*age is significant. I have included the model output below. To clarify, the residuals by predicted plot show a u-shaped and inverted-u shaped curve and visually there is no random pattern. Is this acceptable for this model?
Again, thank you for the response. I look forward to your reply.
ZW

- Mark as New
- Bookmark
- Subscribe
- Mute
- Subscribe to RSS Feed
- Get Direct Link
- Report Inappropriate Content
Re: How do I determine statistical difference in slopes with non-normal data
Glad you picked up on the residual analysis. It is easy to do but many people don't look at it. You have bias in the current model. There are non-linear changes in the response. Maybe not for everyone. But add Age*Age (i.e. X squared) and Age* Age * Individual (curvature not the same for each subject) to the model.
Does it help?
- Mark as New
- Bookmark
- Subscribe
- Mute
- Subscribe to RSS Feed
- Get Direct Link
- Report Inappropriate Content
Re: How do I determine statistical difference in slopes with non-normal data
Mark Bailey,
I have included your suggestions and attached the output. I did have to duplicate the age column (Age-> age) to add the interactions. If this would cause an error please let me know if there are suggested method to properly add the model effects. Thank you again for your quick response.
ZW

- Mark as New
- Bookmark
- Subscribe
- Mute
- Subscribe to RSS Feed
- Get Direct Link
- Report Inappropriate Content
Re: How do I determine statistical difference in slopes with non-normal data
You should not have to create a new data column to enter these terms in the model. Enter ID, Age, and ID*Age as before. Select Age and ID*Age in the list of effects. Select Age in the column list. Click Cross.
This way might also change the statistical results. Your way unnecessarily introduces collinearity. For example, Age is correlated with Age*Age, right? The collinearity will increase the standard error of the estimates, increase the length of the confidence intervals, and reduce the t ratio. The second way first centers the predictors (subtracts mean value), which removes this collinearity. Please try the second way and report your results.
Regarding the non-random pattern in the residual plot, I would not be too concerned. It indicates that there is bias in your model, but the magnitude of the bias, about ±200, for a response up to 15000 is quite a small amount. In fact, your R square is 0.999, so there is little bias. I think it can be ignored for your purpose.
- Mark as New
- Bookmark
- Subscribe
- Mute
- Subscribe to RSS Feed
- Get Direct Link
- Report Inappropriate Content
Re: How do I determine statistical difference in slopes with non-normal data
Mark Bailey,
Sorry for the delayed response. I have completed the model as requested. Thanks for the instruction on how to cross additional variables in the effects table. Below is the output with the requested effects. Thank you again for your help.

ZW
- Mark as New
- Bookmark
- Subscribe
- Mute
- Subscribe to RSS Feed
- Get Direct Link
- Report Inappropriate Content
Re: How do I determine statistical difference in slopes with non-normal data
It appears that the best linear model includes only the Age, ID, and Age*ID terms.
- Mark as New
- Bookmark
- Subscribe
- Mute
- Subscribe to RSS Feed
- Get Direct Link
- Report Inappropriate Content
Re: How do I determine statistical difference in slopes with non-normal data
Mark Bailey,
Great! Returning to the orignal model, is there any part of the model to be concerned about? Also, do you suggest any post-hoc testing to identify which slopes are different from each other? I have included the original output with parameter estimates if that is of any use. Again, thank you for your help and quick response.

ZW
- Mark as New
- Bookmark
- Subscribe
- Mute
- Subscribe to RSS Feed
- Get Direct Link
- Report Inappropriate Content
Re: How do I determine statistical difference in slopes with non-normal data
The observed pattern in the residual by predicted plot is initially alarming but after review we concluded that
- you could not eliminate it with higher order terms (although maybe we should try age*age, age*age*age, and age*age*age*age to be sure),
- it represents a small excursion from random error (compare magnitude of residuals to magnitude of response or examine R square), and
- it appears to be a problem only for one ID level.
How much more do you want to do?
Recommended Articles
- © 2026 JMP Statistical Discovery LLC. All Rights Reserved.
- Terms of Use
- Privacy Statement
- Contact Us