Hi @Y-Y ,
Yes, you can achieve this in the Graph Builder - I'm using the 'Tablet Production' sample data (found under help > sample index) to give this example.
Go to Graph Builder and place your X and Y responses into the correct box (i.e. Dissolution v API Particle Size).

Click the bar chart tool to activate the bars

Add the character column that you are using to guide the 'stacking' of the variables (i.e. Screen Size).

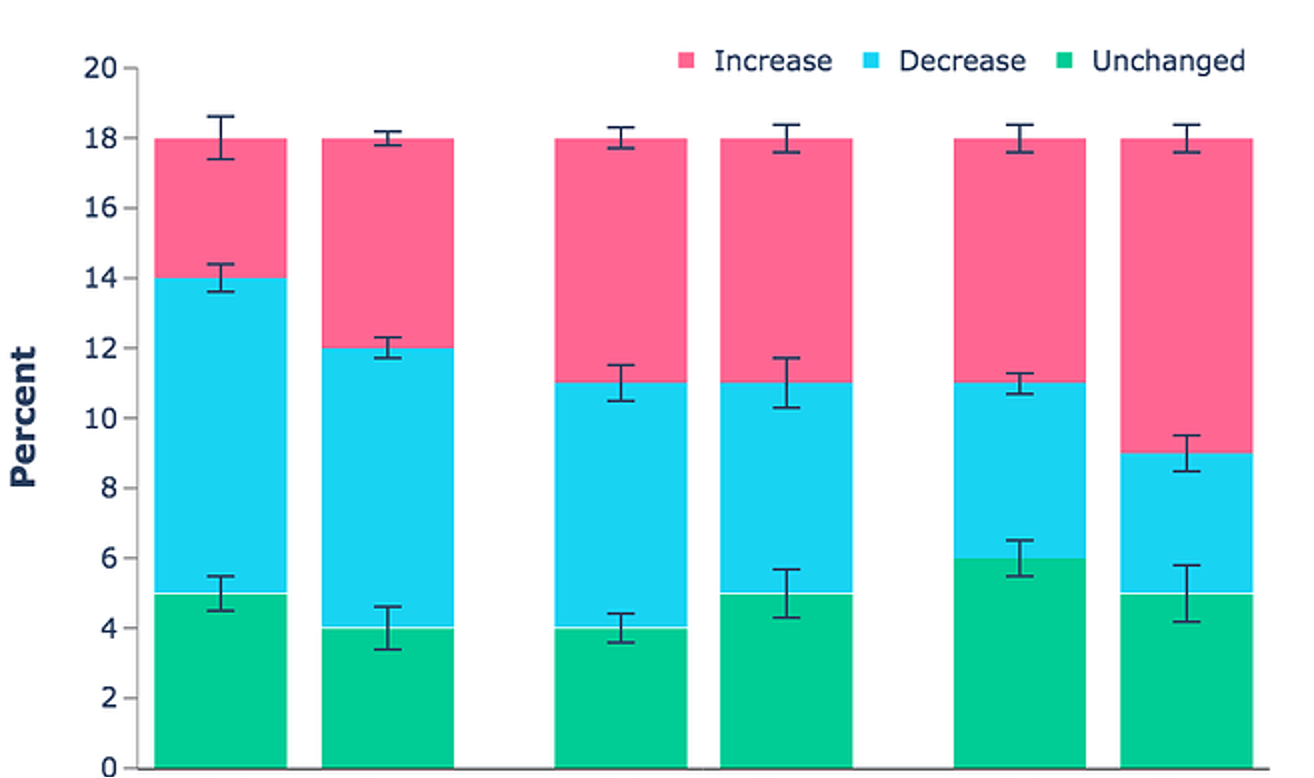
Right click the 'Bar' box on the top and go to Bar Style > Stacked

Error bars don't appear for stacked bars as JMP can't tell where the error is meant to be calculated.
Thanks,
Ben
“All models are wrong, but some are useful”

