- DownloadSemiconductor Toolkit: Tools to create wafer maps, add wafer geometry to graphics, explore die defects & compare wafers.
- Discovery Summit 2026: Early User Edition - September 23-24.Register. It's free.
- See how to use JMP Pro to analyze and predict using entire data set rather than selected points in a curve. Register for Nov. 6 Mastering JMP.
- Subscribe to RSS Feed
- Mark Topic as New
- Mark Topic as Read
- Float this Topic for Current User
- Bookmark
- Subscribe
- Mute
- Printer Friendly Page
Discussions
Solve problems, and share tips and tricks with other JMP users.- User Community
- :
- Discussions
- :
- Graph for Response Surface Methodology

- Mark as New
- Bookmark
- Subscribe
- Mute
- Subscribe to RSS Feed
- Get Direct Link
- Report Inappropriate Content
Graph for Response Surface Methodology
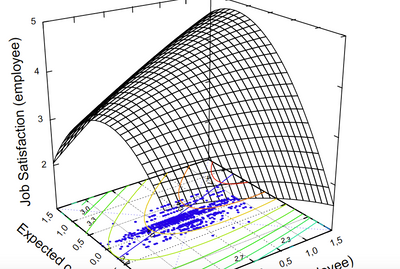
Hi, JMP experts, this question has been bothering me for a long while. I hope to get answered with your help.
I am trying to do RSM with one DV and two IV, all continuous and I am wondering how to create a three dimensional graph as shown in attached. I saw that graph in a paper that uses similar designs, and hope that JMP has this function of creating this graph. Thank you!
- Mark as New
- Bookmark
- Subscribe
- Mute
- Subscribe to RSS Feed
- Get Direct Link
- Report Inappropriate Content
Re: Graph for Response Surface Methodology
Your answer is very thoughtful, Mark, esp. instructive for a new learner as me.
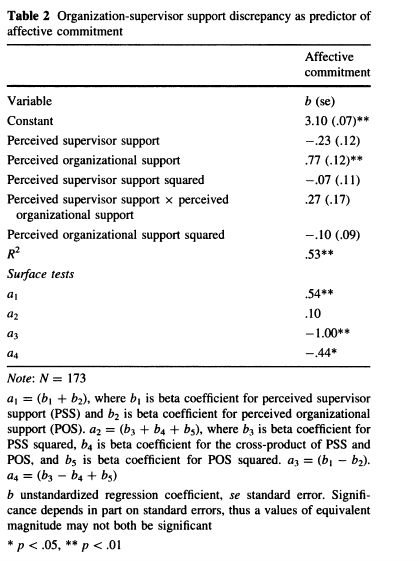
As I am reading more literature, I came across a term called "surface test", as shown in the attached screenshot. Can I ask JMP to do that? Thank you!
- Mark as New
- Bookmark
- Subscribe
- Mute
- Subscribe to RSS Feed
- Get Direct Link
- Report Inappropriate Content
Re: Graph for Response Surface Methodology
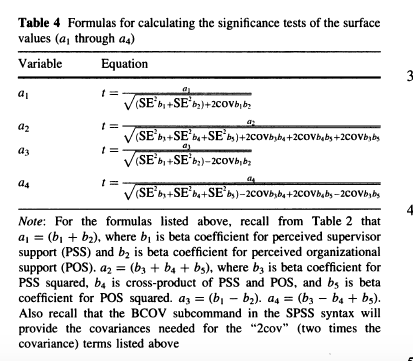
Follow up: This is the formula the article provided. I am wondering if JMP could do the test automatically. Thank you.
- « Previous
-
- 1
- 2
- Next »
Recommended Articles
- © 2026 JMP Statistical Discovery LLC. All Rights Reserved.
- Terms of Use
- Privacy Statement
- Contact Us