- Learn how to build custom Python data connectors and further customize JMP’s Data Connector Framework with the Python Data Connector Demo, available now in the JMP Marketplace!
- See how to create experiments to support product design and ID useful product features. Register for June 12 webinar, 2pm US Eastern Time.
- Subscribe to RSS Feed
- Mark Topic as New
- Mark Topic as Read
- Float this Topic for Current User
- Bookmark
- Subscribe
- Mute
- Printer Friendly Page
Discussions
Solve problems, and share tips and tricks with other JMP users.- JMP User Community
- :
- Discussions
- :
- Re: Exclude outlier in box plot

- Mark as New
- Bookmark
- Subscribe
- Mute
- Subscribe to RSS Feed
- Get Direct Link
- Report Inappropriate Content
Exclude outlier in box plot
Hello,
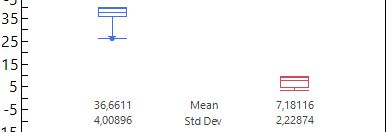
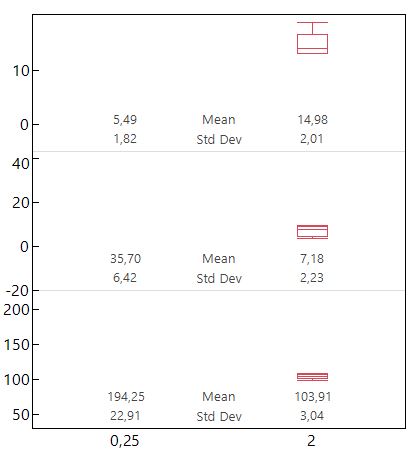
I'm comparing two parameter sets in a box plot. Each set includes has 10 reps for statistics. And obviously there is one outlier in it (see attached file).
Is there a way to include the outlier in the graphic, but exclude it from the statistics? I tried the "exclude" status for the row, the statistics are corrected then, but the outlier disapears (it works for the points plot, but I would like to keep the box plot).

- Mark as New
- Bookmark
- Subscribe
- Mute
- Subscribe to RSS Feed
- Get Direct Link
- Report Inappropriate Content
Re: Exclude outlier in box plot
Hide and exclude are independent row states. You can change the state of each one without affecting the other. JMP platforms generally respect both of these row states. Is it possible that you selected Hide and Exclude command instead of just Exclude command from the Rows menu?
- Mark as New
- Bookmark
- Subscribe
- Mute
- Subscribe to RSS Feed
- Get Direct Link
- Report Inappropriate Content
Re: Exclude outlier in box plot
Hello Mark,
thanks for your quick reply.
On Friday I figured out an even better solution for my problem: I found the mistake we did in the measurement.. now the outlier is gone.
But for the sake of this topic:
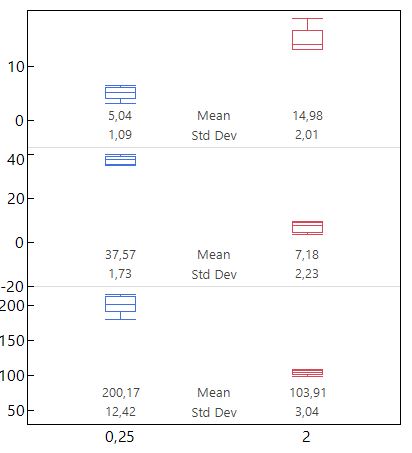
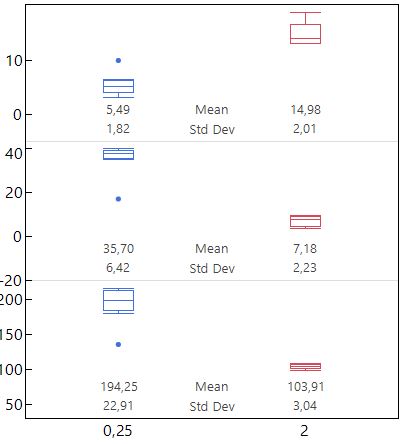
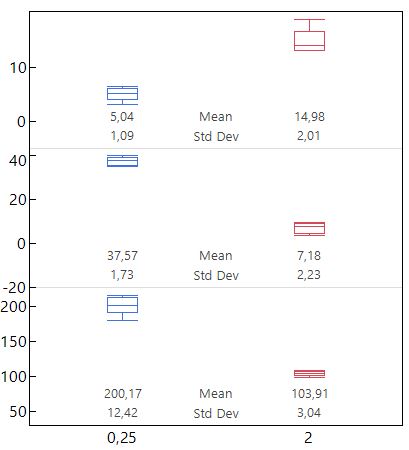
No, I tried all three commands Hide and Exclude, Exclude and Hide. For the box plot Hide and Exclude and Exclude gave the same result. Both times the outlier was not included in the calculation but also not visible. When I switched to points plot however it worked as I expected it.
When I tried Hide instead, the whole box plot disappeared..
I recreated the scenario and attached some screenshots. The abbreviations are clear I hope.
Recommended Articles
- © 2026 JMP Statistical Discovery LLC. All Rights Reserved.
- Terms of Use
- Privacy Statement
- Contact Us