- New to JMP? Join us Sept. 23-24 for the Early User Edition of Discovery Summit, tailor-made for new users. Register now for free!
- Your voice matters! Tell us how you prefer to receive JMP updates, so we can tailor our communication to your needs. Take short survey.
- See how to access JMP Marketplace - and - find, create & share add-ins to extend your JMP. Watch video.
- Subscribe to RSS Feed
- Mark Topic as New
- Mark Topic as Read
- Float this Topic for Current User
- Bookmark
- Subscribe
- Mute
- Printer Friendly Page
Discussions
Solve problems, and share tips and tricks with other JMP users.- JMP User Community
- :
- Discussions
- :
- Equivalence test

- Mark as New
- Bookmark
- Subscribe
- Mute
- Subscribe to RSS Feed
- Get Direct Link
- Report Inappropriate Content
Equivalence test
Hello
I want to compare two analytical methods that measure the purity of my samples and prove they are equivalent. I know they don't provide the exact same results which means the mean of their difference is not 0. However, I only need to prove that the difference between their results is less than 2%. My data are based on 28 different samples and each sample was analyzed once by each method. We tested the equivalence with a two-sided t-test on the purity difference but we are not sure this test is the most appropriate to prove the concept. Please not that the data is not normally distributed. Can someone please advise on this?
Accepted Solutions

- Mark as New
- Bookmark
- Subscribe
- Mute
- Subscribe to RSS Feed
- Get Direct Link
- Report Inappropriate Content
Re: Equivalence test
Hi @CentroidJackal1 ,
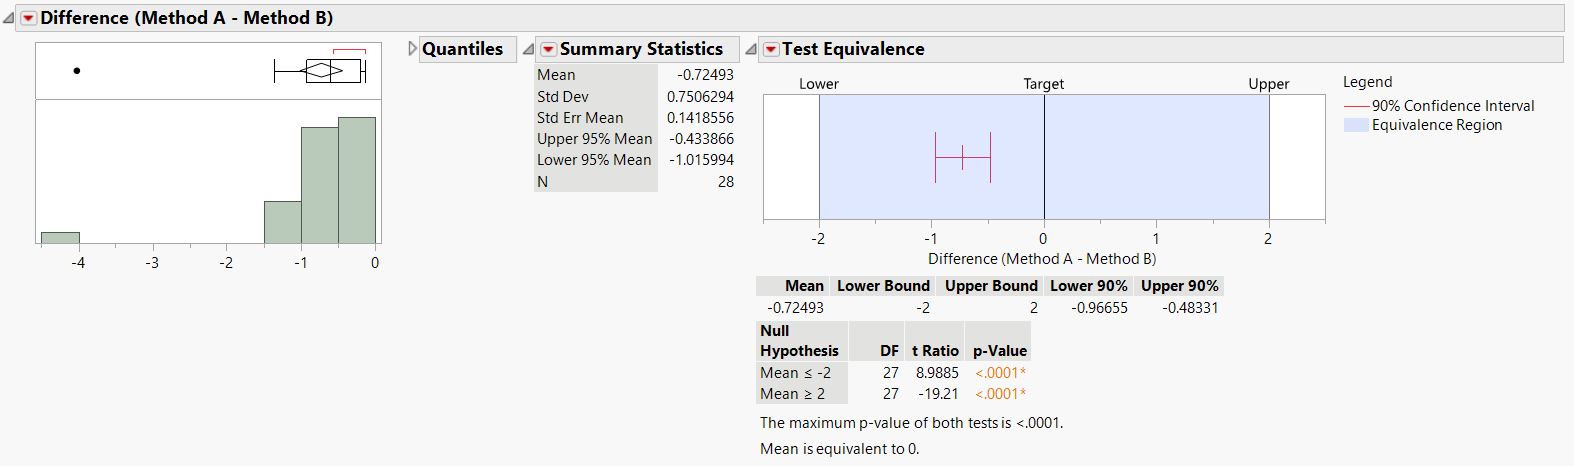
I believe your equivalence test shows that you can't reject the equivalency of the two methods -- to within +/-2 units of 0. In the example that you provide, the average difference is -0.72, and since you're accepting anything within +/-2 units of 0, then that the average difference suggests that the values are equivalent. The red whiskers on the average difference are the confidence bounds on that mean difference.
Something to keep in mind is that this equivalence test is looking at the mean difference of all your 28 measurements. It says nothing about a single measurement. So, I think one should be careful about saying the difference will "always" be less than 2 (at whatever confidence you've decided ahead of time). What really should be discussed is that the average difference is less than +/-2 units from 0. This is illustrated by your distribution where you have at least one data point with a difference of -4. In this particular case, this one (or more) measurement(s) has a difference greater than +/-2 units from 0, and would fail your original description. However, the average of all measurements does not fail the description.
The BA analysis should give you this information as well, as you can estimate the confidence interval on the mean-difference plot and see how many of the measurements fall outside these lines as well as determine if there is any bias in one method or the other. With the BA analysis, you can get a pretty good estimate of how many data points will be outside your CIs and hence give a more reasonable estimate of what you'd like to answer, which is for any given measurement, you have a confidence level of X that the difference is within +/-2 units.
You might also consider doing an ANOVA analysis, where you can again do an equivalence test on the means -- but in this case you would use the actual measurement values, and even though you know the absolute values of A and B might not be the same, you can still do the equivalence test to within +/-2 units. The nice thing here is that you can account for unequal variances if need be -- for example if method A and B don't have similar standard deviations.
With either of the equivalence tests, you're really looking at either the difference in means or the mean difference -- for all your measurements, and that should be made clear. A single measurement can always be an outlier, but if the mean response of each method is equivalent, it should pass the equivalence test.
Good luck!,
DS
- Mark as New
- Bookmark
- Subscribe
- Mute
- Subscribe to RSS Feed
- Get Direct Link
- Report Inappropriate Content
Re: Equivalence test
Hi @CentroidJackal1 ,
The way you present and propose is definitely one way to evaluate the data. One thing to keep in mind though, is that when you say the difference in the results need to be less than 2%, 2% of which one, method A or method B? This part was not well explained.
Another way to look at the data might be with a mean-difference plot, much like a Bland-Altman analysis. You can read up on it from the link. This is a good way to evaluate if two different methods are essentially equivalent and to see if there's any bias in the data and if it's coming from one method versus another. The BA analysis doesn't require normally distributed data.
Hope this helps!,
DS

- Mark as New
- Bookmark
- Subscribe
- Mute
- Subscribe to RSS Feed
- Get Direct Link
- Report Inappropriate Content
Re: Equivalence test
Hi @SDF1
Thank you so much for the quick reply. Apologies for the confusion. The purity is expressed as percentage so that's why I put 2% but the difference is the absolute value and I want to prove that there is a certain confidence to say the difference will "always" (for 90%, 95% or 99% of the population) be less than 2. I am not sure the BA analysis will prove that point as it seems like it will only prove that there is a bias between the two methods.
Many thanks,
Jennifer.
- Mark as New
- Bookmark
- Subscribe
- Mute
- Subscribe to RSS Feed
- Get Direct Link
- Report Inappropriate Content
Re: Equivalence test
Hi @CentroidJackal1 ,
I believe your equivalence test shows that you can't reject the equivalency of the two methods -- to within +/-2 units of 0. In the example that you provide, the average difference is -0.72, and since you're accepting anything within +/-2 units of 0, then that the average difference suggests that the values are equivalent. The red whiskers on the average difference are the confidence bounds on that mean difference.
Something to keep in mind is that this equivalence test is looking at the mean difference of all your 28 measurements. It says nothing about a single measurement. So, I think one should be careful about saying the difference will "always" be less than 2 (at whatever confidence you've decided ahead of time). What really should be discussed is that the average difference is less than +/-2 units from 0. This is illustrated by your distribution where you have at least one data point with a difference of -4. In this particular case, this one (or more) measurement(s) has a difference greater than +/-2 units from 0, and would fail your original description. However, the average of all measurements does not fail the description.
The BA analysis should give you this information as well, as you can estimate the confidence interval on the mean-difference plot and see how many of the measurements fall outside these lines as well as determine if there is any bias in one method or the other. With the BA analysis, you can get a pretty good estimate of how many data points will be outside your CIs and hence give a more reasonable estimate of what you'd like to answer, which is for any given measurement, you have a confidence level of X that the difference is within +/-2 units.
You might also consider doing an ANOVA analysis, where you can again do an equivalence test on the means -- but in this case you would use the actual measurement values, and even though you know the absolute values of A and B might not be the same, you can still do the equivalence test to within +/-2 units. The nice thing here is that you can account for unequal variances if need be -- for example if method A and B don't have similar standard deviations.
With either of the equivalence tests, you're really looking at either the difference in means or the mean difference -- for all your measurements, and that should be made clear. A single measurement can always be an outlier, but if the mean response of each method is equivalent, it should pass the equivalence test.
Good luck!,
DS
- Mark as New
- Bookmark
- Subscribe
- Mute
- Subscribe to RSS Feed
- Get Direct Link
- Report Inappropriate Content
Re: Equivalence test

- Mark as New
- Bookmark
- Subscribe
- Mute
- Subscribe to RSS Feed
- Get Direct Link
- Report Inappropriate Content
Re: Equivalence test
There are numerous long-standing standards (e.g., NCCLS, IUPAC, ICH) about method comparison. It can involve a number of aspects of the measurement: accuracy, precision, linearity, limit of detection or quantitation, and so on. You can using Fit Orthogonal command in Bivariate to perform a Deming regression that minimizes the error in X and Y. JMP 17 will also include Passing-Bablok regression and Bland-Altman analysis. In the meantime, see the JMP Help chapter about Measurement System Analysis for more ideas.
- Mark as New
- Bookmark
- Subscribe
- Mute
- Subscribe to RSS Feed
- Get Direct Link
- Report Inappropriate Content
Re: Equivalence test
Hi @Mark_Bailey
Thanks for your reply. The fit orthogonal is saying that the methods are not equivalent just like the fit line. We know the methods don't give the same results exactly and that there is a bias but we want to prove this bias is not significant. Does that make more sense?
Many thanks,
Jennifer.
- Mark as New
- Bookmark
- Subscribe
- Mute
- Subscribe to RSS Feed
- Get Direct Link
- Report Inappropriate Content
Re: Equivalence test
If the models are not equivalent, then the bias is significant.
- Mark as New
- Bookmark
- Subscribe
- Mute
- Subscribe to RSS Feed
- Get Direct Link
- Report Inappropriate Content
Re: Equivalence test
I should have replied that your equivalence test demonstrates sufficient evidence to reject the null hypothesis that the methods are different by more than 2% at the 95% confidence level.
- Mark as New
- Bookmark
- Subscribe
- Mute
- Subscribe to RSS Feed
- Get Direct Link
- Report Inappropriate Content
Re: Equivalence test
Recommended Articles
- © 2026 JMP Statistical Discovery LLC. All Rights Reserved.
- Terms of Use
- Privacy Statement
- Contact Us