- Don’t miss your chance to experience Discovery Summit Europe at our best available rate! Early bird registration through 31 Oct.
- Graph Builder Toolbar streamlines interactive graphing. Creates shortcuts on Report and GraphBuilder Helpers toolbars. Download and install the extension.
- JMP will suspend normal business operations for our Rest and Recharge Day on Friday, October 2, 2026.
Regular business hours will resume on Monday, October 5, 2026.
- Subscribe to RSS Feed
- Mark Topic as New
- Mark Topic as Read
- Float this Topic for Current User
- Bookmark
- Subscribe
- Mute
- Printer Friendly Page
Discussions
Solve problems, and share tips and tricks with other JMP users.- User Community
- :
- Discussions
- :
- Re: Determination of product specs by Stability Results

- Mark as New
- Bookmark
- Subscribe
- Mute
- Subscribe to RSS Feed
- Get Direct Link
- Report Inappropriate Content
Determination of product specs by Stability Results
I would ask an help for the following problem.
I got data from a stability study of my product.
By using the tool Reliability and survivor> Degradation I got a prediction of the expiration date based on the spec that I have now.
In order to extend this expiration data I cuould need to change the spec.
For example
-my product spec say: not less than 100 Pa
-I have product in stability that at time 0 have 150 Pa
-Runing the stability after 15 months my product goes to 120 Pa
-Degradation tools sayd that I will got 100 after 29 months
I want determining which starting properties I need to have in order to reach 36 month. There is tool in JMP, by using the data that I already have, that allow me to determining it?
Thanks
Ivo
- Tags:
- Reliability Analysis


- Mark as New
- Bookmark
- Subscribe
- Mute
- Subscribe to RSS Feed
- Get Direct Link
- Report Inappropriate Content
Re: Determination of product specs by Stability Results
JMP does not have such a tool. If I understand your question, you want to know what baseline or starting value you need, instead of 150, to achieve 100 at 36 months, assuming the same rate of degradation and the same degradation path.
This problem is simple high school algebra. The degradation rate R from your stability study is R = (100-150) / (29-0) = -50/29. The degradation path equation is 100 = Y + R*36. So the necessary starting value for Y = 100 + (50/29)*36 = 160.07.
- Mark as New
- Bookmark
- Subscribe
- Mute
- Subscribe to RSS Feed
- Get Direct Link
- Report Inappropriate Content
Re: Determination of product specs by Stability Results
Hi Mark, Thanks for you reply.
You got point.
But this is something that happen in Algebra in ideal world, you right.
I can extrapolate a linear regression to do that and evaluate my needed spec to met the desired expiration date.
My real problem is that I have different lots of product, with slightly different behaviour.
And I could have product that by changing slightly the spec give me a product with different behaviour.
For example, in the JMP tool Degradation>stability test, it consider an FDA model to evaluate how manage different different lots and extrapolate a date.
There is a way to make the evaluation that I want with a more accurate strategy, that take in consideration what I described?
- Mark as New
- Bookmark
- Subscribe
- Mute
- Subscribe to RSS Feed
- Get Direct Link
- Report Inappropriate Content
Re: Determination of product specs by Stability Results
I am confused. I thought that you wanted to know what starting value would lead to expiry of 36 months. That request seems reasonable. It would require a reformulation and new lots to change the starting value.
The specification is determined by performance requirements but now I think that you want to know, for the same starting value (existing lots), what specification would yield expiry of 36 months. You can use the Stability Test application within the Degradation platform to estimate the specification that corresponds to a crossing point of 36 months, although this seems to be the wrong direction.
Yes, the Stability Test application is based on a SAS macro that was written to apply the inference outlined in the ICH Q1E guidance for assessing poolability and expiry.
- Mark as New
- Bookmark
- Subscribe
- Mute
- Subscribe to RSS Feed
- Get Direct Link
- Report Inappropriate Content
Re: Determination of product specs by Stability Results
I'm sorry for the confusion. My fault
It's correct your first understanding. I want to know what starting value of my properties I need in order to match expiration date of 36 months.
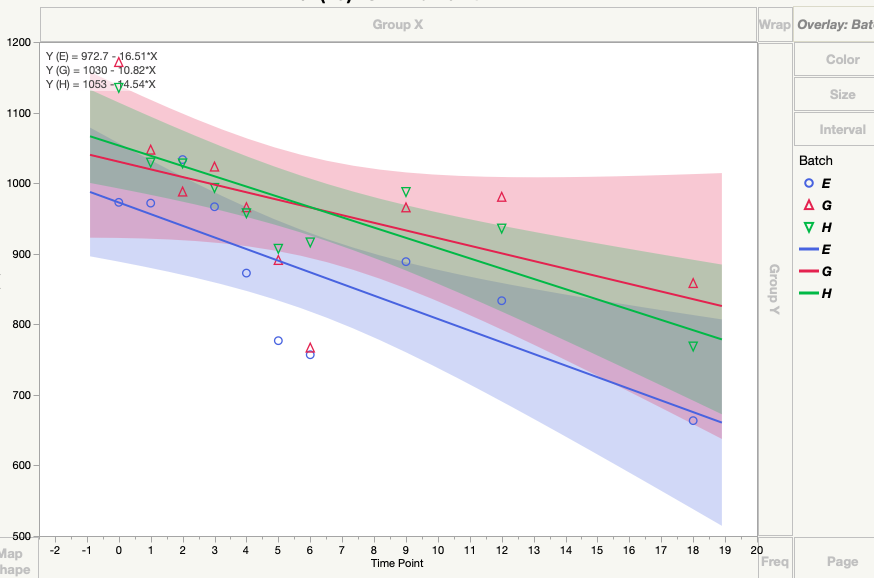
In attached I have plotted the behaviour of 3 batch. In the plot is presented the variable of interesting vs time. Each batch one have different slope.
1)I could take in consideration the equation of one batch, put 36 month in the X and discover the Y that I need.
But wich equation I have to take? the average of all lots?
2)Also I can presume that I have one equation for each batch that it depend of the starting value of the batch.
Which error I will?
There is no way to have a prediction of the behavior by changing the starting value of the properties?
In other words.....if you have starting property of 100 you need follow this equation.... if you have starting property of130 you need to follow this equation.....
By having this prediction I can try follow the point 1)
- Mark as New
- Bookmark
- Subscribe
- Mute
- Subscribe to RSS Feed
- Get Direct Link
- Report Inappropriate Content
Re: Determination of product specs by Stability Results
The plot you showed looks like Graph Builder. Am I correct? The Stability Test in the Degradation platform will help you determine if you can pool the batches or not, and if not, which lot to use. The decision about pooling and the model is yours based on the default alpha = 0.25 or an alternative alpha that you determine.
- Mark as New
- Bookmark
- Subscribe
- Mute
- Subscribe to RSS Feed
- Get Direct Link
- Report Inappropriate Content
Re: Determination of product specs by Stability Results
Yes, it is Graph Builder.
As you suggested I performed the Degradation test.
According with the alpha, i have on 3 batches different intercept and common slope, AS guidelines suggest.
Please, How I can put out the equation from this platform?
- Mark as New
- Bookmark
- Subscribe
- Mute
- Subscribe to RSS Feed
- Get Direct Link
- Report Inappropriate Content
Re: Determination of product specs by Stability Results
I mocked up your case of different intercepts but a common slope across 3 batches. I selected Analyze > Reliability > Degradation. I selected the Stability Test tab and entered Response, Time, and Batch into their respective analysis roles. I saved a script to the data table for this set up. I find the following results that should appear similar to your results:
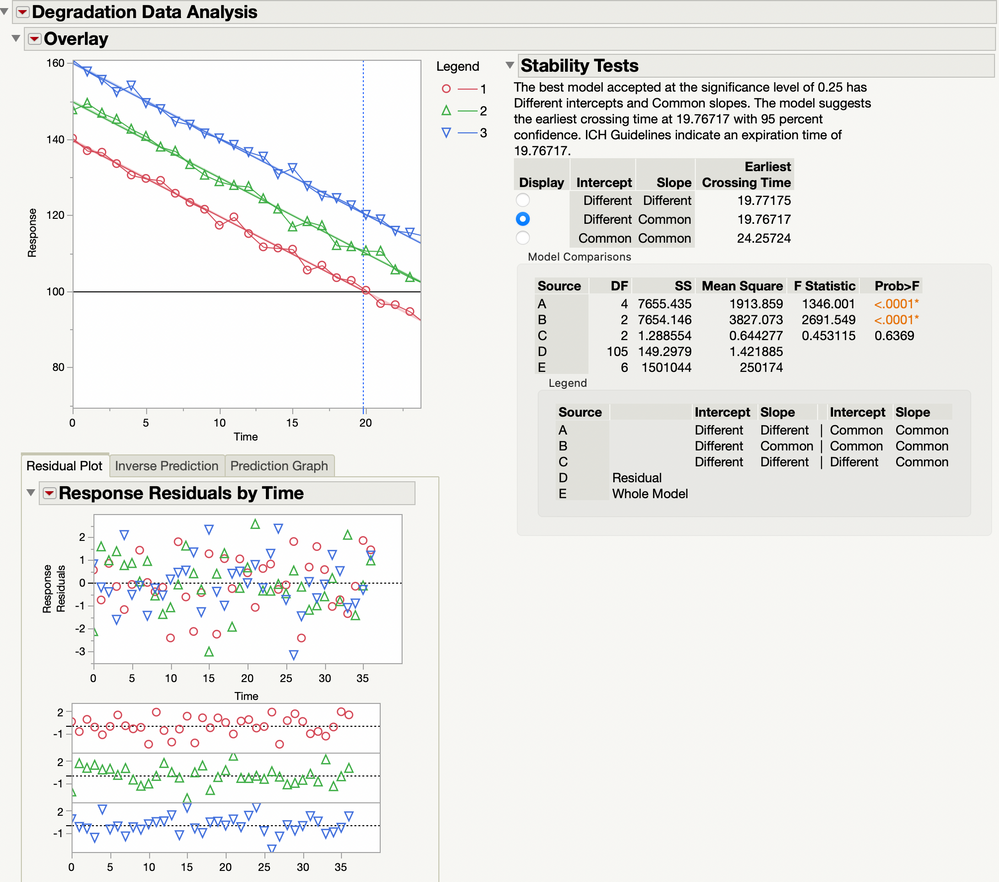
The second model is selected automatically using the default α = 0.25 for statistical significance. So the relevant information is found in the Model 2 - Simple Linear Path under the Reports outline:
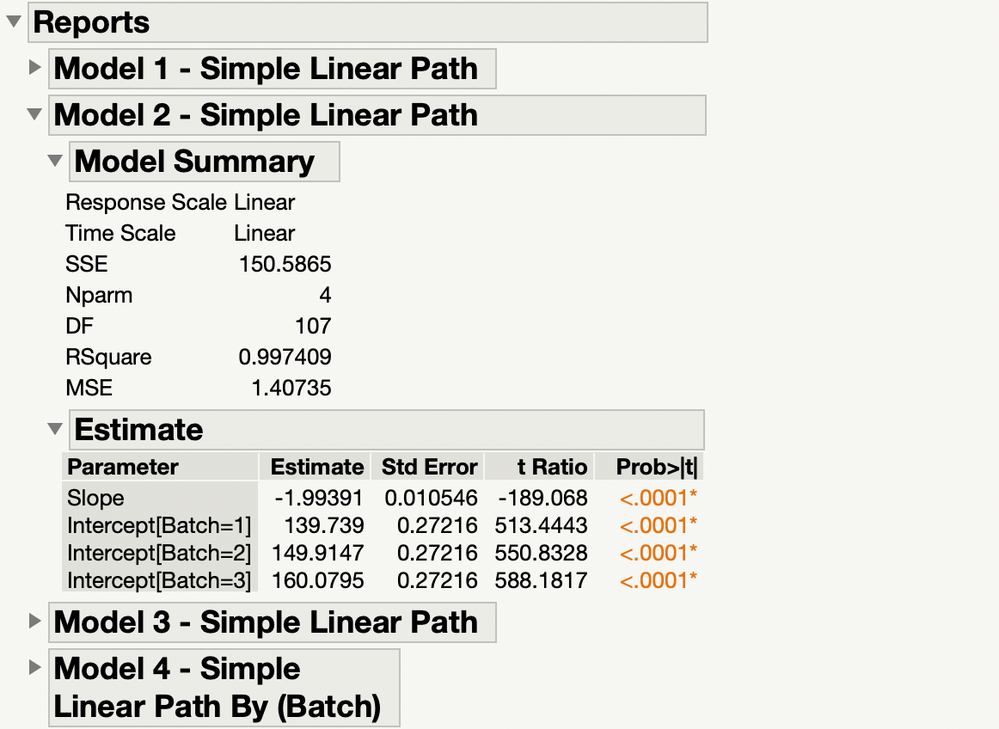
Your case is one in which the response is decreasing over time, so the batch with lowest intercept will cross the lower specification first. So the equation is response = 139.739 - 1.99391*Time.
Recommended Articles
- © 2026 JMP Statistical Discovery LLC. All Rights Reserved.
- Terms of Use
- Privacy Statement
- Contact Us