- Instantly extract effect sizes, F-ratios, and FDR-adjusted p-values from your models with the Calculate Effects Sizes extension, available now in the JMP Marketplace!
- New to JMP? Join us Sept. 23-24 for the Early User Edition of Discovery Summit, tailor-made for new users. Register now for free!
- See how to use the JMP Marketplace – Free tools to expand JMP capabilities. Register. July 10, 2 pm US Eastern Time.
- Subscribe to RSS Feed
- Mark Topic as New
- Mark Topic as Read
- Float this Topic for Current User
- Bookmark
- Subscribe
- Mute
- Printer Friendly Page
Discussions
Solve problems, and share tips and tricks with other JMP users.- JMP User Community
- :
- Discussions
- :
- Control chart builder JMP 19 - How to group together X axis values

- Mark as New
- Bookmark
- Subscribe
- Mute
- Subscribe to RSS Feed
- Get Direct Link
- Report Inappropriate Content
Control chart builder JMP 19 - How to group together X axis values
Hello,
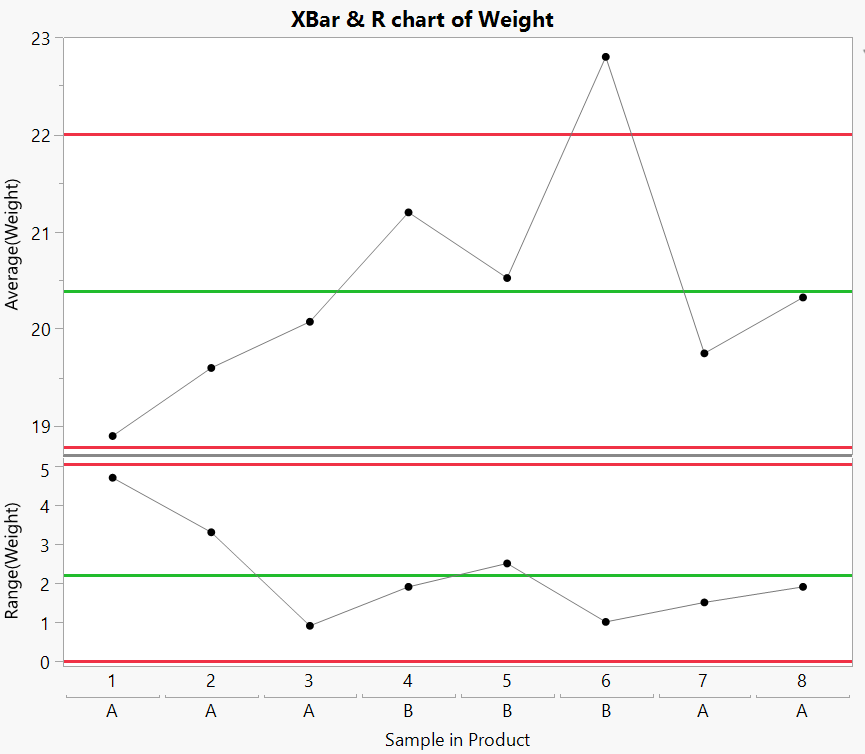
We migrated from JMP18 to JMP19 and noticed a change in behavior in the control chart builder. In the example below, I have a double X-axis with Sample first and then Product. I liked the fact that in JMP18 the values were grouped together, which made it more visually readable. I know that in this example the order is different because category A comes at the end, but let's assume that this was not the case; it doesn't change the visual.
Since JMP19, I have a repetition of my product sub-axis: A, A, A, A, B, B, B... which is not great for me visually. Is there a way to merge them, as was possible in JMP 18?
Attached the control charts picture in JMP18 and 19
Names Default To Here( 1 );
dt = Open( "$SAMPLE_DATA/Quality Control/Coating.jmp" );

dt << Control Chart Builder(
	Variables(
		Subgroup( :Product ),
		Subgroup( :Sample, Position( 1 ) ),
		Y( :Weight )
	),
	Show Control Panel( 0 )
);
Accepted Solutions

- Mark as New
- Bookmark
- Subscribe
- Mute
- Subscribe to RSS Feed
- Get Direct Link
- Report Inappropriate Content
Re: Control chart builder JMP 19 - How to group together X axis values
Does enabling Sort By Subgroup (from red triangle menu) do what you are looking for?
- Mark as New
- Bookmark
- Subscribe
- Mute
- Subscribe to RSS Feed
- Get Direct Link
- Report Inappropriate Content
Re: Control chart builder JMP 19 - How to group together X axis values
Does enabling Sort By Subgroup (from red triangle menu) do what you are looking for?
- Mark as New
- Bookmark
- Subscribe
- Mute
- Subscribe to RSS Feed
- Get Direct Link
- Report Inappropriate Content
Re: Control chart builder JMP 19 - How to group together X axis values
Yes thank you!
Recommended Articles
- © 2026 JMP Statistical Discovery LLC. All Rights Reserved.
- Terms of Use
- Privacy Statement
- Contact Us