- Image to Table JMP extension imports single or batch images as data tables. Useful to extract curves from pictures or convert image data to curve data to use in analyses like Functional Data Explorer. Download and install the extension.
- Subscribe to RSS Feed
- Mark Topic as New
- Mark Topic as Read
- Float this Topic for Current User
- Bookmark
- Subscribe
- Mute
- Printer Friendly Page
Discussions
Solve problems, and share tips and tricks with other JMP users.- User Community
- :
- Discussions
- :
- Re: Control chart builder JMP 19 - How to group together X axis values

- Mark as New
- Bookmark
- Subscribe
- Mute
- Subscribe to RSS Feed
- Get Direct Link
- Report Inappropriate Content
Control chart builder JMP 19 - How to group together X axis values
Hello,
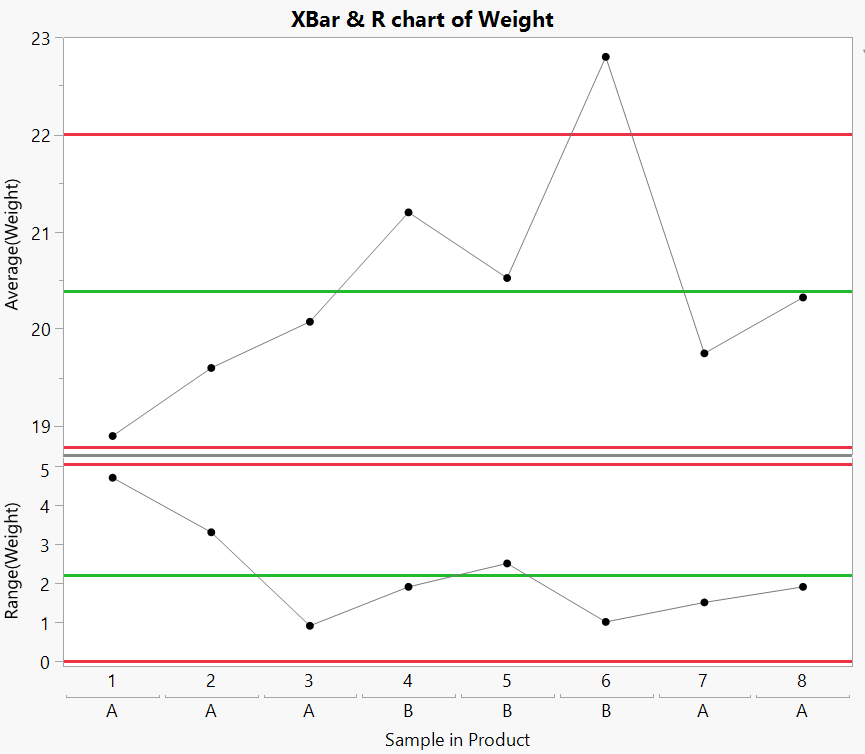
We migrated from JMP18 to JMP19 and noticed a change in behavior in the control chart builder. In the example below, I have a double X-axis with Sample first and then Product. I liked the fact that in JMP18 the values were grouped together, which made it more visually readable. I know that in this example the order is different because category A comes at the end, but let's assume that this was not the case; it doesn't change the visual.
Since JMP19, I have a repetition of my product sub-axis: A, A, A, A, B, B, B... which is not great for me visually. Is there a way to merge them, as was possible in JMP 18?
Attached the control charts picture in JMP18 and 19
Names Default To Here( 1 );
dt = Open( "$SAMPLE_DATA/Quality Control/Coating.jmp" );

dt << Control Chart Builder(
	Variables(
		Subgroup( :Product ),
		Subgroup( :Sample, Position( 1 ) ),
		Y( :Weight )
	),
	Show Control Panel( 0 )
);
Accepted Solutions



- Mark as New
- Bookmark
- Subscribe
- Mute
- Subscribe to RSS Feed
- Get Direct Link
- Report Inappropriate Content
Re: Control chart builder JMP 19 - How to group together X axis values
Does enabling Sort By Subgroup (from red triangle menu) do what you are looking for?
- Mark as New
- Bookmark
- Subscribe
- Mute
- Subscribe to RSS Feed
- Get Direct Link
- Report Inappropriate Content
Re: Control chart builder JMP 19 - How to group together X axis values
Does enabling Sort By Subgroup (from red triangle menu) do what you are looking for?
- Mark as New
- Bookmark
- Subscribe
- Mute
- Subscribe to RSS Feed
- Get Direct Link
- Report Inappropriate Content
Re: Control chart builder JMP 19 - How to group together X axis values
Yes thank you!
Recommended Articles
- © 2026 JMP Statistical Discovery LLC. All Rights Reserved.
- Terms of Use
- Privacy Statement
- Contact Us