- Don’t miss your chance to experience Discovery Summit Europe at our best available rate! Early bird registration through 31 Oct.
- Graph Builder Toolbar streamlines interactive graphing. Creates shortcuts on Report and GraphBuilder Helpers toolbars. Download and install the extension.
- Subscribe to RSS Feed
- Mark Topic as New
- Mark Topic as Read
- Float this Topic for Current User
- Bookmark
- Subscribe
- Mute
- Printer Friendly Page
Discussions
Solve problems, and share tips and tricks with other JMP users.- User Community
- :
- Discussions
- :
- Can JMP show the probability of 1 result or range through a graph?

- Mark as New
- Bookmark
- Subscribe
- Mute
- Subscribe to RSS Feed
- Get Direct Link
- Report Inappropriate Content
Can JMP show the probability of 1 result or range through a graph?
Hello everyone!!!, a question:
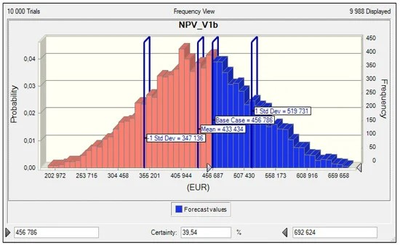
What graph in JMP can answer the probabilities of obtaining a value or range of response, for example like the following graph.
Greetings,
Marco


- Mark as New
- Bookmark
- Subscribe
- Mute
- Subscribe to RSS Feed
- Get Direct Link
- Report Inappropriate Content
Re: Can JMP show the probability of 1 result or range through a graph?
1. Simulation
- What do you mean by "for each objective?"
- Where will your simulation results be found? In a JMP data table?
- Can the histogram in Distribution be used, or do you prefer a histogram in Graph Builder?
- A value does not have a probability. It only has a density. The histogram you show above has 'bins' to count data occurring in a range. Do you mean the frequency in a bin when you ask for the probability of a value?
- The inverse operation is ill-defined on a histogram.
2. Model
- What model do you use?
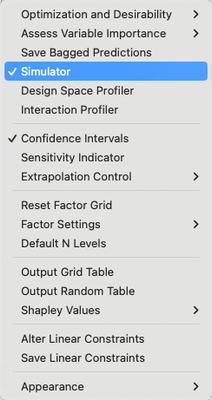
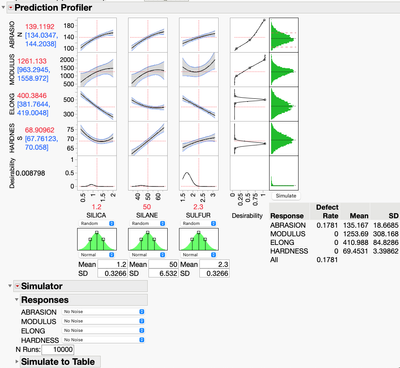
- What is the function that you want to profile with the Prediction Profiler?
In general, you might be thinking in terms of frequency, not probability.
- Mark as New
- Bookmark
- Subscribe
- Mute
- Subscribe to RSS Feed
- Get Direct Link
- Report Inappropriate Content
Re: Can JMP show the probability of 1 result or range through a graph?
Hello Mark,
Sorry for not letting me understand... although it may be the translator (Spanish-English), my question is... if it is possible that JMP, after a simulation using a bar graph, can answer:
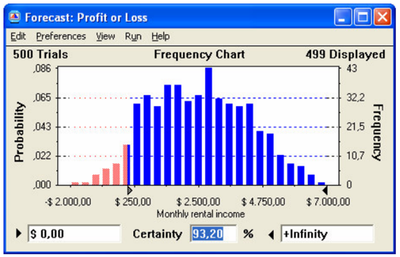
The value in the certainty field changes to reflect the probability of an income level for a range from positive US$0 to positive infinity, that is, the chance of achieving a profit (profit greater than or equal to US$0) is approximately 93.20 %
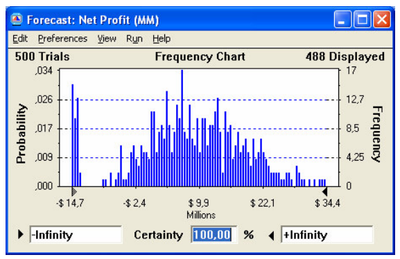
This graph shows all the possible results, that is, in an investment there is the possibility of losing US$ 14.7 million until winning US 34.4 million and the certainty field shows 100% since the initial range of certainty includes all possible values.
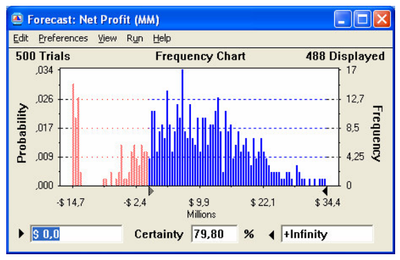
Question 1: What is the probability of not losing money or the income being US$0?
Answer 1: 79.80% or 20.20% to lose (100 minus 79.80)
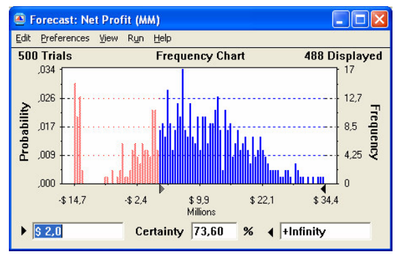
Question 2: What is the probability of achieving a minimum profit of US$ 2 million?
Answer 2: 73.60%
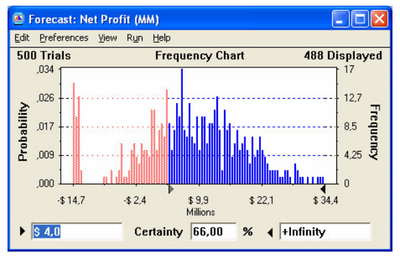
Question 3: What is the probability of achieving a minimum profit of US$ 4 million?
Answer 3: 66.00%
Greetings,
Marco

- Mark as New
- Bookmark
- Subscribe
- Mute
- Subscribe to RSS Feed
- Get Direct Link
- Report Inappropriate Content
Re: Can JMP show the probability of 1 result or range through a graph?
I'm very familiar with the displays you are showing - they are regular outputs of Excel simulation programs. I don't know of an automatic JMP capability that shows the same - but this will provide the same kind of information, though not quite the same display. You can Analyze Distribution for any variable (it could be the prediction formula from a model or just a variable you have data on). If you save the Probability Scores you get a column of the cumulative probabilities associated with the values of that variable - this is a new column in your data set. You can then use Fit Y by X, with the probability scores as Y and the variable values as X. This will reproduce the cumulative probability distribution. Choose to show the histogram borders.
Now, if you highlight a portion of the histogram border for your X variable, the corresponding cumulative probability associated with that value will show up as the Y value. You can interactively use this to "discover" the types of probabilities you show in your examples, albeit without the automatic graphs. Perhaps somebody knows a way to script producing those graphs - but that is not my expertise.
- Mark as New
- Bookmark
- Subscribe
- Mute
- Subscribe to RSS Feed
- Get Direct Link
- Report Inappropriate Content
Re: Can JMP show the probability of 1 result or range through a graph?
Hi Dale,
Ingenious solution!!!....surely someone with a command of scripting could create an add-in for JMP that calculates the certainty of a response or range, just like the examples I shared.
Greetings,
Marco

 Community Manager
- Mark as New
- Bookmark
- Subscribe
- Mute
- Subscribe to RSS Feed
- Get Direct Link
- Report Inappropriate Content
Re: Can JMP show the probability of 1 result or range through a graph?

- Mark as New
- Bookmark
- Subscribe
- Mute
- Subscribe to RSS Feed
- Get Direct Link
- Report Inappropriate Content
Re: Can JMP show the probability of 1 result or range through a graph?
If you want to calculate the percentage of the selected part of a distribution, you can plot the distribution in Graph Builder and use a column formula to display the percentage.
Here I took the height distribution in students.jmp, but the same holds for some income, profit etc.
Open( "$SAMPLE_DATA/Students.jmp" );

New Column( "percent",
	Formula(
		(Col Number( If( Selected(), :height, . ) ) / Col Number( :height )) * 100
	)
);
New Column( "one",Nominal, Set each value( 1 ));
:percent << Label( 1 ); // I forgot to add this to the script, thanks @Dale_lehman
Graph Builder(
	Size( 590, 393 ),
	Show Control Panel( 0 ),
	Show Legend( 0 ),
	Variables( X( :height ), Y( :one ), Y( :height ) ),
	Relative Sizes( "Y", [59 231] ),
	Elements( Position( 1, 1 ), Heatmap( Y, Legend( 6 ), Label( "Label by Row" ) ) ),
	Elements( Position( 1, 2 ), Histogram( X, Y, Legend( 9 ) ) )
);- Mark as New
- Bookmark
- Subscribe
- Mute
- Subscribe to RSS Feed
- Get Direct Link
- Report Inappropriate Content
Re: Can JMP show the probability of 1 result or range through a graph?
Hello Hogi,
Nice to greet you, a great idea!! It is the closest thing to the examples I shared... I tried to do it but I couldn't, could you share an example of the process (start - end)?, thank you!
Greetings
Marco
- Mark as New
- Bookmark
- Subscribe
- Mute
- Subscribe to RSS Feed
- Get Direct Link
- Report Inappropriate Content
Re: Can JMP show the probability of 1 result or range through a graph?
The JSL code shows the individual steps.
Some steps are just "workarounds" and don't have an apparent "goal"
(like the Heatmap plot to create a display area for the computed value - or the column "one" to get a single heatmap cell.
This video shows how to do it manually:
- The histogram works as well without a value on the y axis
- but you need a value on the y axis to add the second subplot on top. So just use any column you want (it will be ignored). - percentage is created as a formula column - and is later used as "row" label for the heatmap plot to shoe the percentage in the plot.
[I added the label tag already in the beginning - I forgot to add this part in the first version of the JSL code, Thanks @dale_lehman for highlighting.] - to create the display area for the percentage:
- use a heatmap graph with just 1 cell:
- to do so, use a column with constant value (1, or "X") - or disabling the Y variable
- remove the X subgroups from the heatmap by disabling the X variable
Then the graph is ready. Just some cosmetics like adjusting the dimensions, bar widths and colors.
- Mark as New
- Bookmark
- Subscribe
- Mute
- Subscribe to RSS Feed
- Get Direct Link
- Report Inappropriate Content
Re: Can JMP show the probability of 1 result or range through a graph?
If you prefer a slider to select the range, you can use a data filter.
dt = Open( "$SAMPLE_DATA/Students.jmp" );

New Column( "percent",
	Formula( (Col Number( If( Selected(), :height, . ) ) / Col Number( :height )) * 100 )
);
New Window( "plot",
	V List Box(
		Graph Builder(
			Show Control Panel( 0 ),
			Show Legend( 0 ),
			Show Title( 0 ),
			Variables( X( :height ), Y( :height ), Y( :height ) ),
			Elements( Position( 1, 1 ), Heatmap( Label( "Label by Row" ) ) ),
			Elements( Position( 1, 2 ), Histogram( X, Y ) )
		),
		dt << Data Filter(
			Add Filter( columns( :height ) ),
			Title( "" ),
			Show Controls( 0 ),
			Show Modes( 0 ),
			Show Counts( 0 ),
			Show Histograms and Bars( 0 )
		)
	)
)
;- Mark as New
- Bookmark
- Subscribe
- Mute
- Subscribe to RSS Feed
- Get Direct Link
- Report Inappropriate Content
Re: Can JMP show the probability of 1 result or range through a graph?
Hello Hogi,
The option to use a filter is practical! The JTHI script is similar to the example I shared, it would be great if it were an add-in in JMP.
Greetings,
Marco
Recommended Articles
- © 2026 JMP Statistical Discovery LLC. All Rights Reserved.
- Terms of Use
- Privacy Statement
- Contact Us