- JMP Statement Regarding Critical PHP Remote Code Execution Vulnerabilities (CVE-2026-109618, CVE-2026-109619)
- Don’t miss your chance to experience Discovery Summit Europe at our best available rate! Early bird registration through 31 Oct.
- Graph Builder Toolbar streamlines interactive graphing. Creates shortcuts on Report and GraphBuilder Helpers toolbars. Download and install the extension.
- Subscribe to RSS Feed
- Mark Topic as New
- Mark Topic as Read
- Float this Topic for Current User
- Bookmark
- Subscribe
- Mute
- Printer Friendly Page
Discussions
Solve problems, and share tips and tricks with other JMP users.- User Community
- :
- Discussions
- :
- Re: Bug in graph builder with grid lines and right side axes?

- Mark as New
- Bookmark
- Subscribe
- Mute
- Subscribe to RSS Feed
- Get Direct Link
- Report Inappropriate Content
Bug in graph builder with grid lines and right side axes?
I think I found a bug (in JMP 12.1). Please try this script:
dt = Open("$SAMPLE_DATA/Big Class.jmp");
gb = dt << Graph Builder(
Size( 570, 667 ),
Show Control Panel( 0 ),
Variables(
X( :age ),
Y( :height ),
Y( :weight, Position( 1 ), Side( "Right" ) ),
Y( :age ),
Y( :name )
),
Elements(
Position( 1, 1 ),
Points( X, Y( 1 ), Legend( 5 ) ),
Smoother( X, Y( 1 ), Legend( 6 ) ),
Points( X, Y( 2 ), Legend( 7 ) ),
Smoother( X, Y( 2 ), Legend( 8 ) )
),
Elements( Position( 1, 2 ), Points( X, Y, Legend( 10 ) ) ),
Elements( Position( 1, 3 ), Points( X, Y, Legend( 11 ) ) ),
SendToReport(
Dispatch(
{},
"height",
ScaleBox,
{Label Row( {Show Major Grid( 0 ), Show Minor Grid( 0 )} )}
),
Dispatch(
{},
"weight",
ScaleBox,
{Label Row( {Show Major Grid( 1 ), Show Minor Grid( 1 )} )}
)
),
SendToReport(
Dispatch( {}, "age", ScaleBox( 2 ), {Label Row( Show Major Grid( 0 ) )} ),
Dispatch( {}, "name", ScaleBox, {Label Row( Show Major Grid( 0 ) )} )
)
);
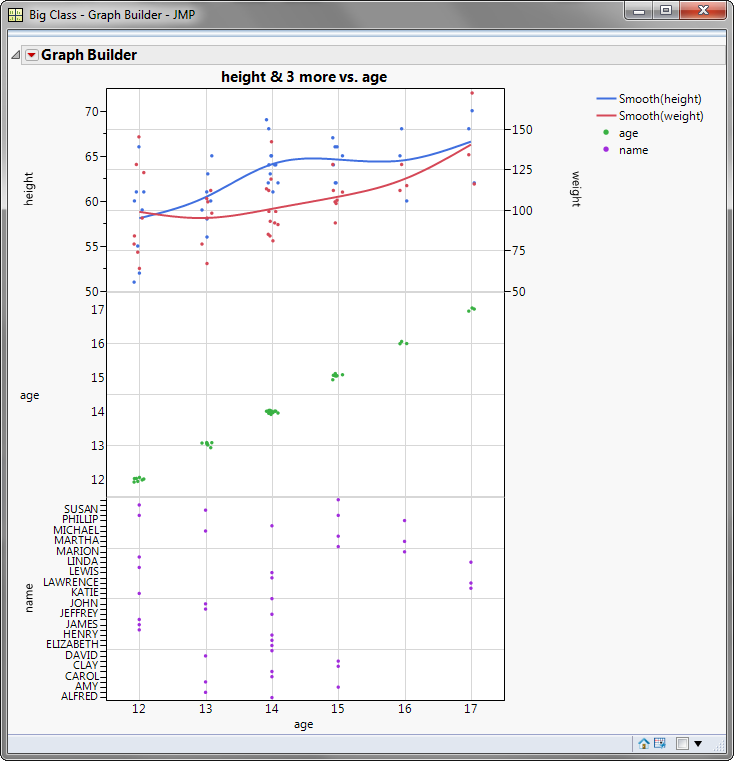
If the checkboxes "Major Grid Lines" and "Minor Grid Lines" are NOT checked in Preferences (Styles -> Tick Marks and Grid Lines) the graph looks ok. But if they are checked you will get the grid lines from "weight" for the parameters "age" and "name". These grid lines disappear when you move "weight" to the left. Very strange.
Can anybody explain what is happening here or is it just a bug?
- Mark as New
- Bookmark
- Subscribe
- Mute
- Subscribe to RSS Feed
- Get Direct Link
- Report Inappropriate Content
Re: Bug in graph builder with grid lines and right side axes?
PS: You even get the grid lines for "age" and "name" if the grid lines for "weight" are turned off:
| Dispatch( |
| {}, |
| "weight", |
| ScaleBox, |
| {Label Row( {Show Major Grid( 0 ), Show Minor Grid( 0 )} )} |
| ) |
Recommended Articles
- © 2026 JMP Statistical Discovery LLC. All Rights Reserved.
- Terms of Use
- Privacy Statement
- Contact Us