cancel
Showing results for 
Show  only  | Search instead for 
Did you mean: 
  • DownloadSemiconductor Toolkit: Tools to create wafer maps, add wafer geometry to graphics, explore die defects & compare wafers.
  • Discovery Summit 2026: Early User Edition - September 23-24.Register. It's free.
  • JMP multivariate capabilities let you understand relationships between multiple variables simultaneously. See how. Friday, Aug. 14, 2 pm US ET.

Discussions

Solve problems, and share tips and tricks with other JMP users.
Choose Language Hide Translation Bar
Jack_Tang
Level I

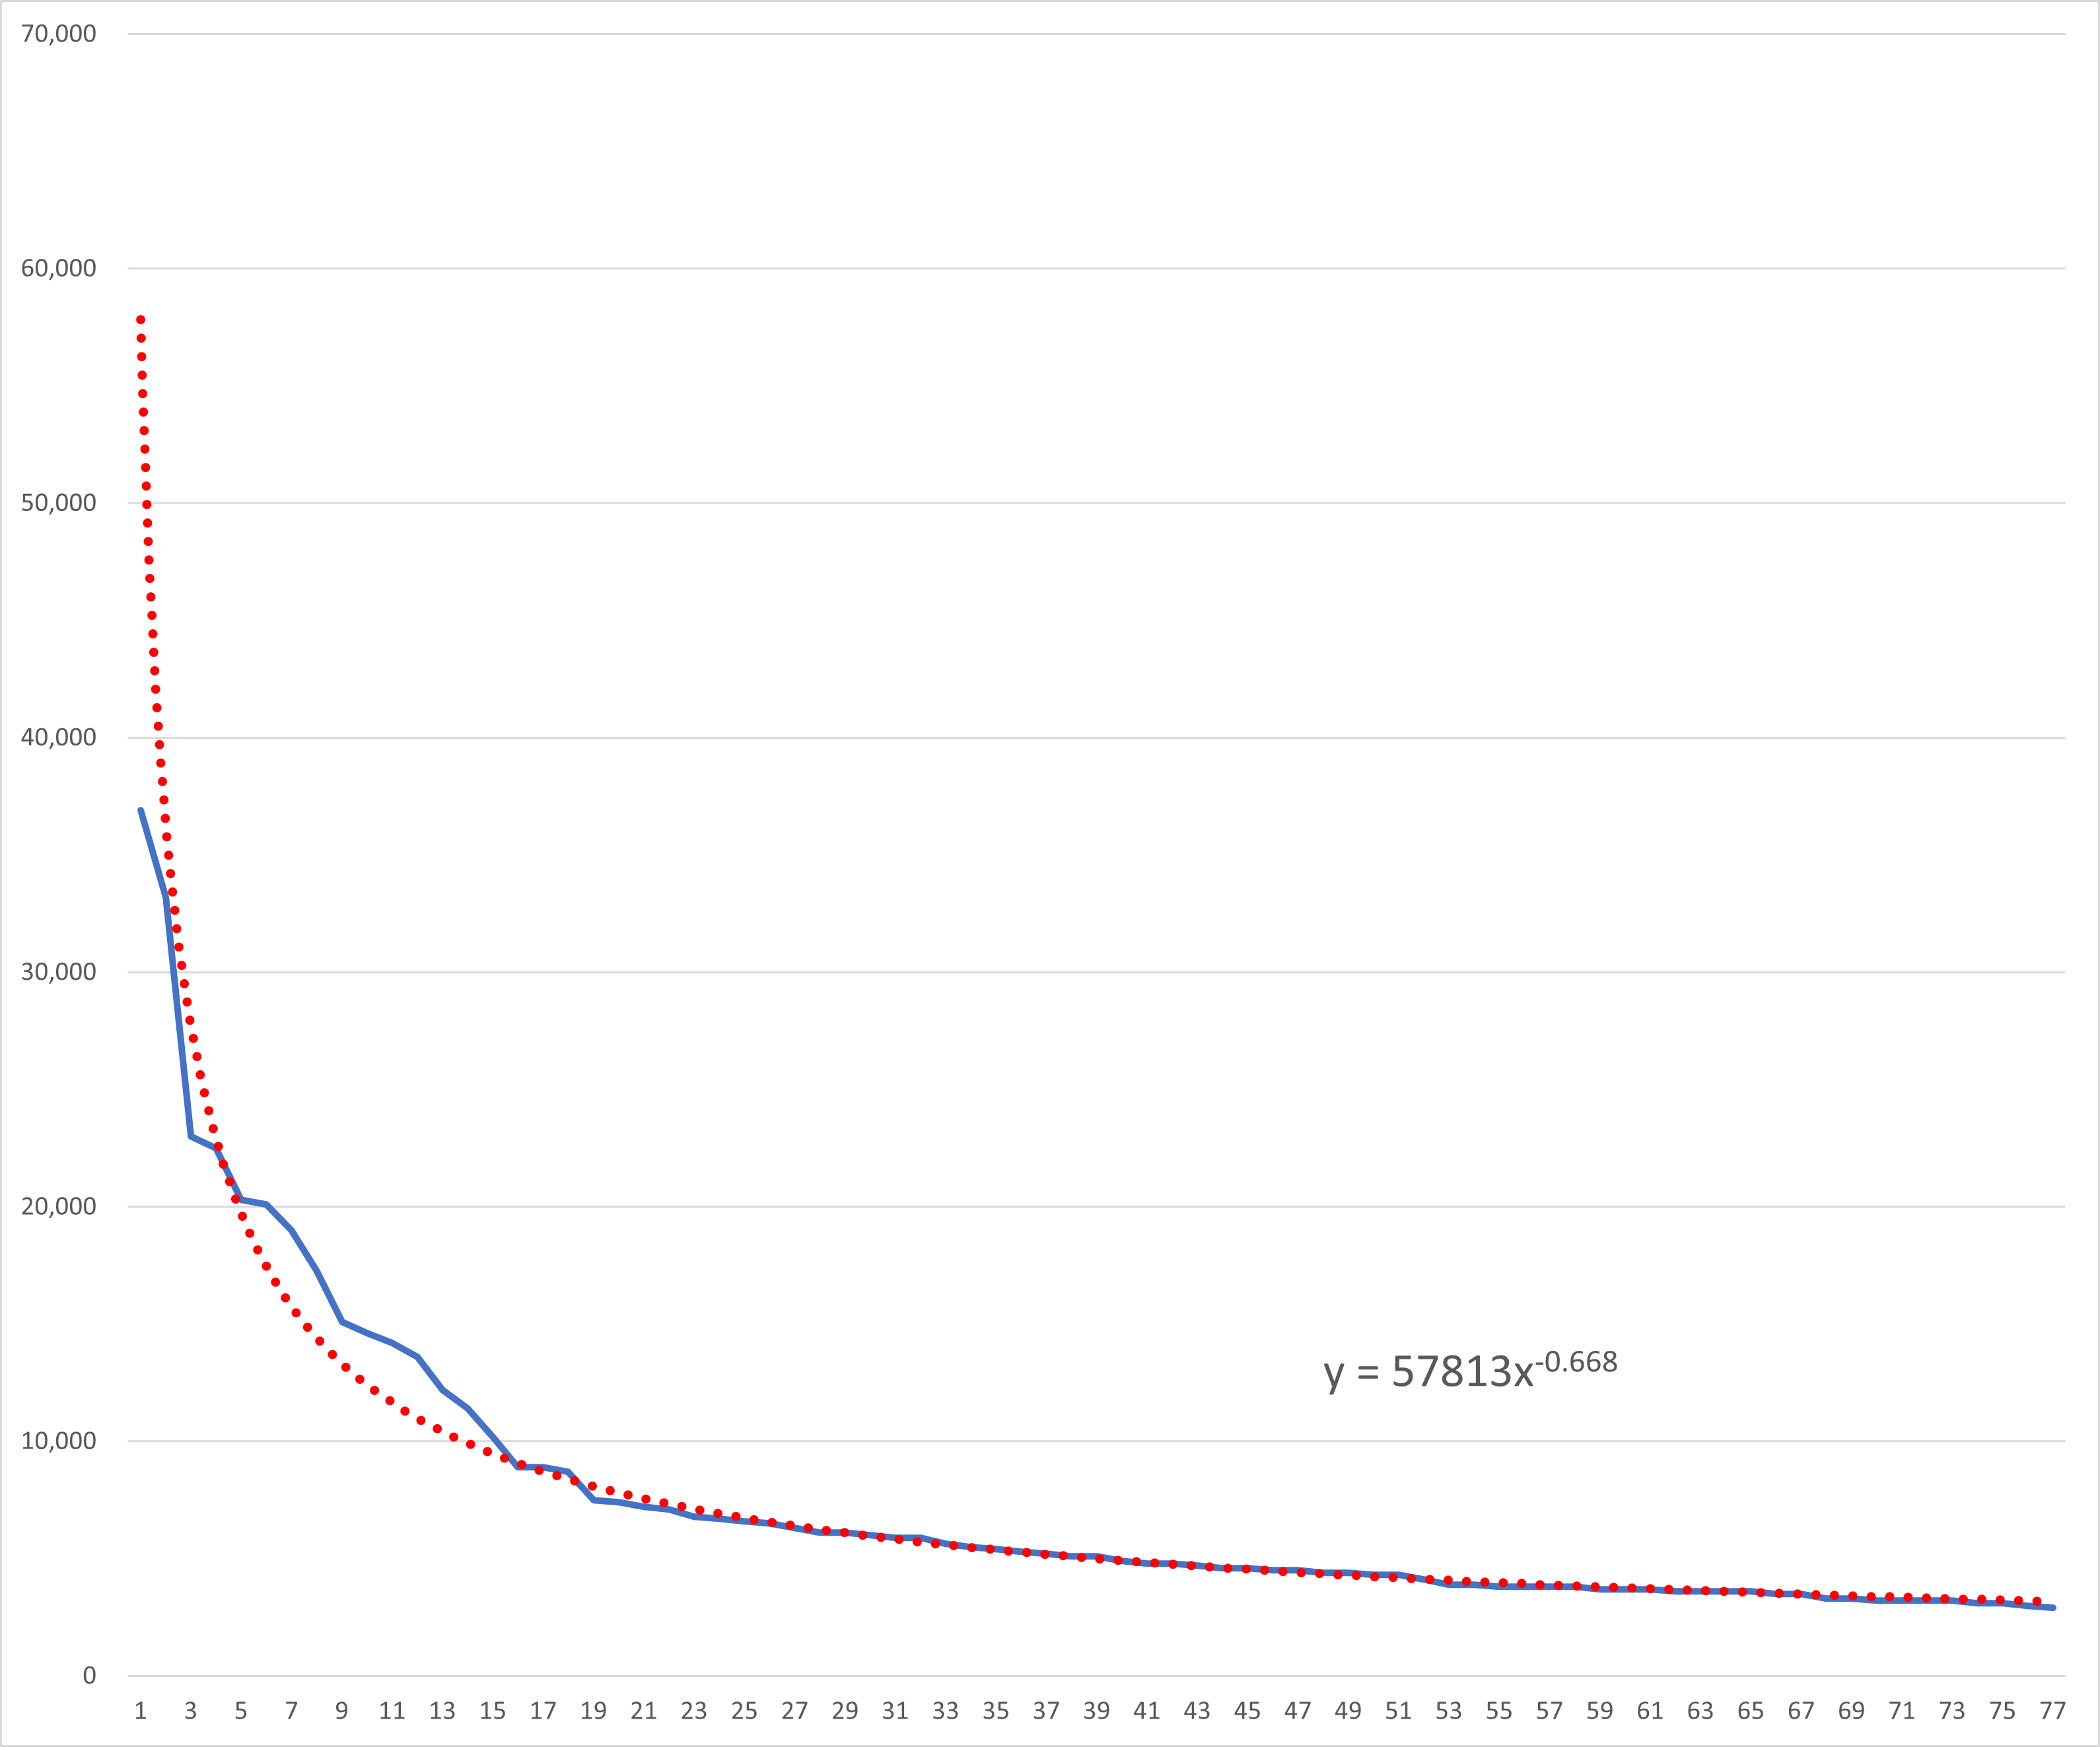
Attachment is failure rate for one material from different lot which was built in different timeframe, how to use JMP to predict the long term upbound failure rate?

 
1 REPLY 1
dale_lehman
Level VII

Re: Attachment is failure rate for one material from different lot which was built in different timeframe, how to use JMP to predict the long term upbound failure rate?

Can you provide some more detail?  Are the lots in chronological order (time series) or are they just sorted from high to low failure rates?  I suspect it is the former in which case you can try to fit time series models to this data.  On the other hand, just a graphical exploration may be sufficient.  I find that a simple power function fits this data quite well (failure rate = 57813*time^-0.668).  Graphically, assuming this is a time series, the failure rate appears to be stabilizing and the long-run prediction from that power function might be appropriate - but I'd need more information to know if that makes any sense).

Recommended Articles