- Don’t miss your chance to experience Discovery Summit Europe at our best available rate! Early bird registration through 31 Oct.
- Graph Builder Toolbar streamlines interactive graphing. Creates shortcuts on Report and GraphBuilder Helpers toolbars. Download and install the extension.
- Subscribe to RSS Feed
- Mark Topic as New
- Mark Topic as Read
- Float this Topic for Current User
- Bookmark
- Subscribe
- Mute
- Printer Friendly Page
Discussions
Solve problems, and share tips and tricks with other JMP users.- User Community
- :
- Discussions
- :
- Add information to point in graph

- Mark as New
- Bookmark
- Subscribe
- Mute
- Subscribe to RSS Feed
- Get Direct Link
- Report Inappropriate Content
Add information to point in graph
Hi all,
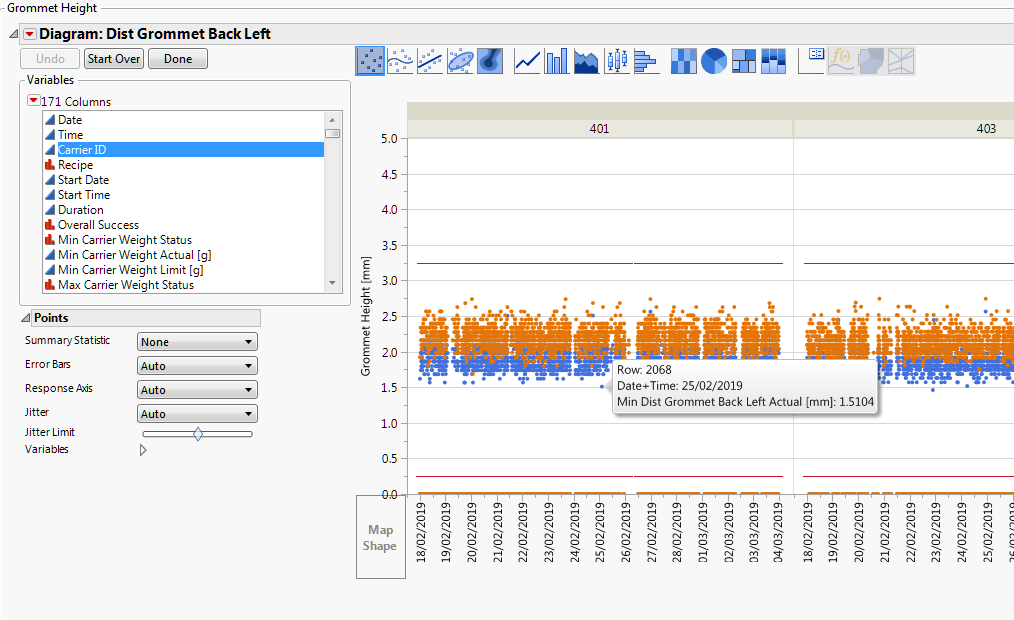
(The following text is related to the attached graph) I would like to see in the interactive HTML file (the way I save the graph) the "Carrier ID" of each single point in the graph when I move the mouse on it. Is there any possibility to show this information although the colunm in not part of the chart itselve?
I was thinking about to add the "Carrier ID" as a text to the "Grommet Height [mm]" so it is visible in the graph when I move the mouse to a point but I was not able to find a way to get this done...
Can anybody help me out here?
Thanks.
Regards,
Daniel
Accepted Solutions

- Mark as New
- Bookmark
- Subscribe
- Mute
- Subscribe to RSS Feed
- Get Direct Link
- Report Inappropriate Content
Re: Add information to point in graph
Hi Daniel, before you save the graph as interactive html, highlight the column(s) you want to display when you hover over the point and then right click with your mouse the column name section of the data table and the 9th or so option in the dialog is "Label/Unlabel". Select that and you will see a label icon appear in the Columns list next to the columns you have selected to have a label. Then when you save as interactive html, your carrier id will be displayed when you move the mouse over the point.
Hope this helps.
- Mark as New
- Bookmark
- Subscribe
- Mute
- Subscribe to RSS Feed
- Get Direct Link
- Report Inappropriate Content
Re: Add information to point in graph
Hi Daniel, before you save the graph as interactive html, highlight the column(s) you want to display when you hover over the point and then right click with your mouse the column name section of the data table and the 9th or so option in the dialog is "Label/Unlabel". Select that and you will see a label icon appear in the Columns list next to the columns you have selected to have a label. Then when you save as interactive html, your carrier id will be displayed when you move the mouse over the point.
Hope this helps.
Recommended Articles
- © 2026 JMP Statistical Discovery LLC. All Rights Reserved.
- Terms of Use
- Privacy Statement
- Contact Us