Turn on suggestions
Auto-suggest helps you quickly narrow down your search results by suggesting possible matches as you type.
- Don’t miss your chance to experience Discovery Summit Europe at our best available rate! Early bird registration through 31 Oct.
- Graph Builder Toolbar streamlines interactive graphing. Creates shortcuts on Report and GraphBuilder Helpers toolbars. Download and install the extension.
Options
- Subscribe to RSS Feed
- Mark Topic as New
- Mark Topic as Read
- Float this Topic for Current User
- Bookmark
- Subscribe
- Mute
- Printer Friendly Page
Discussions
Solve problems, and share tips and tricks with other JMP users.- User Community
- :
- Discussions
- :
- 对已知数据列进行抽样,统计其均值分布的脚本

Level I
- Mark as New
- Bookmark
- Subscribe
- Mute
- Subscribe to RSS Feed
- Get Direct Link
- Report Inappropriate Content
对已知数据列进行抽样,统计其均值分布的脚本
Dec 26, 2025 01:16 AM
(1016 views)
从已知数据列中进行放回(或不放回)抽样,再统计每个样本的均值及分布,这个脚本如何编辑?例如,有2000个数据,每次随机抽取20个数据计算其均值,一共抽取100次,计算这100个样本的均值以及分布状况;
1 ACCEPTED SOLUTION
Accepted Solutions

Level XIII
Solution
- Mark as New
- Bookmark
- Subscribe
- Mute
- Subscribe to RSS Feed
- Get Direct Link
- Report Inappropriate Content
Re: 对已知数据列进行抽样,统计其均值分布的脚本
Created:
Dec 26, 2025 03:54 PM
| Last Modified: Dec 26, 2025 1:23 PM
(983 views)
| Posted in reply to message from jthi 12-26-2025
Here is a script to take 100 subsets and calculate the mean:
dt = Open( "$SAMPLE_DATA/Aircraft Incidents.jmp" );
:Latitude << Format("Best");
dt << Select Where( Is Missing( :Latitude ) ) << Delete Rows;

runs = 100;
//runs= 100000;

results = new table("results", add rows (runs), new column ("mean"));
rows = index (1, nrows(dt));
for each({i},index(1,runs),
myRows = Random Shuffle( rows)[1::20];
data = dt[myRows, "Latitude"];
results[i,"mean"]=Mean(data);
);

my Mean = Col Mean(:mean);
Show(myMean);
... and the mean of the means.
And with this script, you can use the Distribution platform to fit the 100 mean values with "all" available distributions:
dist = results << Distribution(Continuous Distribution(Column( :mean ));	);
dist << Fit All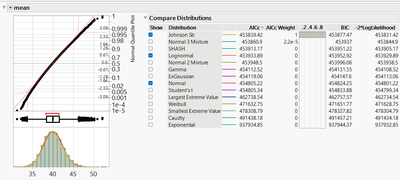
3 REPLIES 3


Super User
- Mark as New
- Bookmark
- Subscribe
- Mute
- Subscribe to RSS Feed
- Get Direct Link
- Report Inappropriate Content
Re: 对已知数据列进行抽样,统计其均值分布的脚本
What do you mean by calculating distribution?
-Jarmo
Level XIII
Solution
- Mark as New
- Bookmark
- Subscribe
- Mute
- Subscribe to RSS Feed
- Get Direct Link
- Report Inappropriate Content
Re: 对已知数据列进行抽样,统计其均值分布的脚本
Created:
Dec 26, 2025 03:54 PM
| Last Modified: Dec 26, 2025 1:23 PM
(984 views)
| Posted in reply to message from jthi 12-26-2025
Here is a script to take 100 subsets and calculate the mean:
dt = Open( "$SAMPLE_DATA/Aircraft Incidents.jmp" );
:Latitude << Format("Best");
dt << Select Where( Is Missing( :Latitude ) ) << Delete Rows;

runs = 100;
//runs= 100000;

results = new table("results", add rows (runs), new column ("mean"));
rows = index (1, nrows(dt));
for each({i},index(1,runs),
myRows = Random Shuffle( rows)[1::20];
data = dt[myRows, "Latitude"];
results[i,"mean"]=Mean(data);
);

my Mean = Col Mean(:mean);
Show(myMean);
... and the mean of the means.
And with this script, you can use the Distribution platform to fit the 100 mean values with "all" available distributions:
dist = results << Distribution(Continuous Distribution(Column( :mean ));	);
dist << Fit All
Level I
- Mark as New
- Bookmark
- Subscribe
- Mute
- Subscribe to RSS Feed
- Get Direct Link
- Report Inappropriate Content
Re: 对已知数据列进行抽样,统计其均值分布的脚本
Thanks!
Recommended Articles
- © 2026 JMP Statistical Discovery LLC. All Rights Reserved.
- Terms of Use
- Privacy Statement
- Contact Us