- New to JMP? Let the Data Analysis Director guide you through selecting an analysis task, an analysis goal, and a data type. Available now in the JMP Marketplace!
- See how to install JMP Marketplace extensions to customize and enhance JMP.
- Subscribe to RSS Feed
- Mark Topic as New
- Mark Topic as Read
- Float this Topic for Current User
- Bookmark
- Subscribe
- Mute
- Printer Friendly Page
Discussions
Solve problems, and share tips and tricks with other JMP users.- JMP User Community
- :
- Discussions
- :
- Percentages with pareto and data filter

- Mark as New
- Bookmark
- Subscribe
- Mute
- Subscribe to RSS Feed
- Get Direct Link
- Report Inappropriate Content
Percentages with pareto and data filter
I have a pareto graph where there is a largo portion of the data that I want to exclude. I have the data excluded, and everything works fine, but the percentage on the right side of the pareto graph shows the percentage of the data that is not excluded in the data filter. I would like the pareto to hide the data but include it in the calculation for the percentage of total. I would like to implement this in a script as well.
- Tags:
- windows

- Mark as New
- Bookmark
- Subscribe
- Mute
- Subscribe to RSS Feed
- Get Direct Link
- Report Inappropriate Content
Re: Percentages with pareto and data filter
I'm not sure I understand exactly, but you have three choices: Hide and Exclude, Exclude/Unexclude & Hide/Unhide. Just use the Hide option.
- Mark as New
- Bookmark
- Subscribe
- Mute
- Subscribe to RSS Feed
- Get Direct Link
- Report Inappropriate Content
Re: Percentages with pareto and data filter
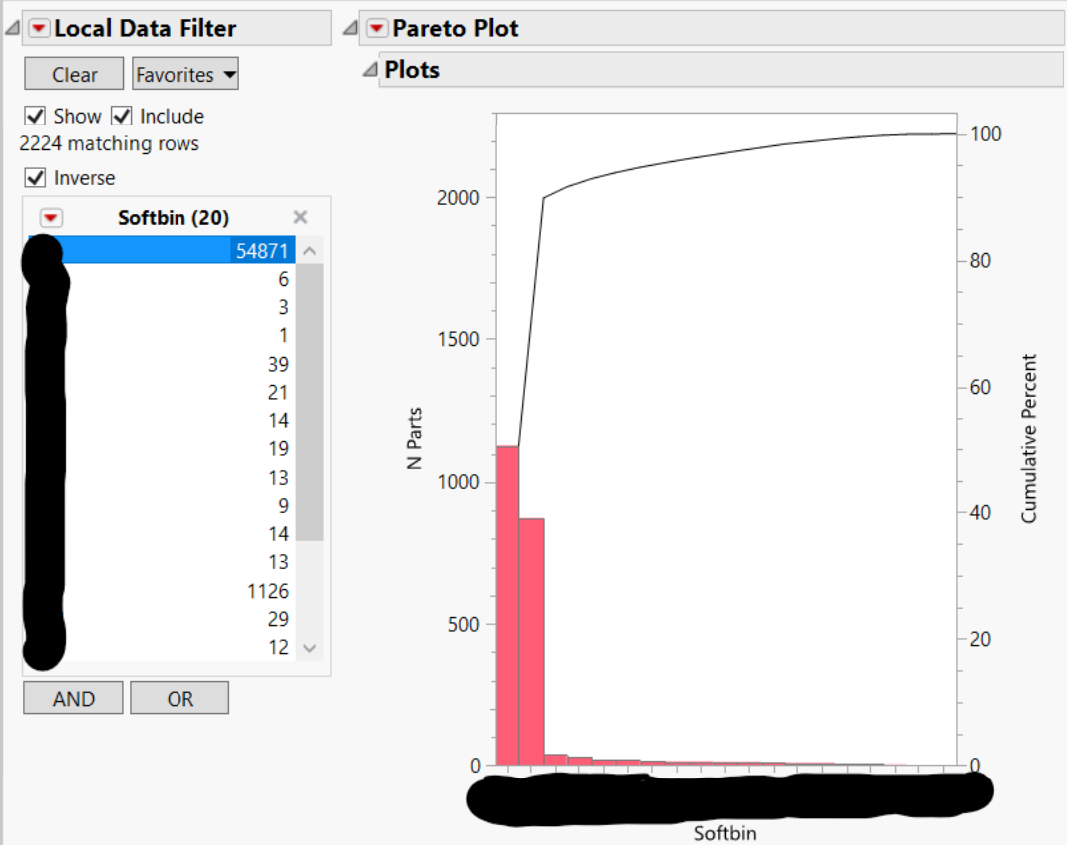
The hide function leaves the bar in the plot though. I essentially want the cumulative percentage to show the true percentage based off of all the data, but I want to hide a portion of that data on the plot. In the plot on the left, all the data is shown. On the right, the giant value is filtered out with the data filter. The cumulative percent on the left is percentage of all parts, while the one on the right is the percentage of each out of the failed parts. I want the graph on the right to show the true total percentage while still hiding the large bar (passing parts). In this scenario the most failed part is around 2% of the lot but on the graph on the right it shows around 50% because it is showing the percentage out of failed parts, when I want it to still show percentage out of the whole. I hope this helps clarify what I am looking for. The hide function did not work like I wanted it to.


- Mark as New
- Bookmark
- Subscribe
- Mute
- Subscribe to RSS Feed
- Get Direct Link
- Report Inappropriate Content
Re: Percentages with pareto and data filter
Maybe take this approach: Don't hide or exclude any of the data and create your pareto chart as shown on the left. Now adjust the x-axis (I did it by dragging) so that the largest bar is off the axis. Kind of a strange approach, but I think it will yield what you are looking for.
Recommended Articles
- © 2026 JMP Statistical Discovery LLC. All Rights Reserved.
- Terms of Use
- Privacy Statement
- Contact Us