Turn on suggestions
Auto-suggest helps you quickly narrow down your search results by suggesting possible matches as you type.
- New to JMP? Join us Sept. 23-24 for the Early User Edition of Discovery Summit, tailor-made for new users. Register now for free!
- Your voice matters! Tell us how you prefer to receive JMP updates, so we can tailor our communication to your needs. Take short survey.
- See how to access JMP Marketplace - and - find, create & share add-ins to extend your JMP. Watch video.
Options
- Subscribe to RSS Feed
- Mark Topic as New
- Mark Topic as Read
- Float this Topic for Current User
- Bookmark
- Subscribe
- Mute
- Printer Friendly Page
Discussions
Solve problems, and share tips and tricks with other JMP users.- JMP User Community
- :
- Discussions
- :
- New graph

Level II
- Mark as New
- Bookmark
- Subscribe
- Mute
- Subscribe to RSS Feed
- Get Direct Link
- Report Inappropriate Content
New graph
Created:
Feb 18, 2023 08:10 AM
| Last Modified: Jun 8, 2023 9:34 AM
(3939 views)
Dear All,
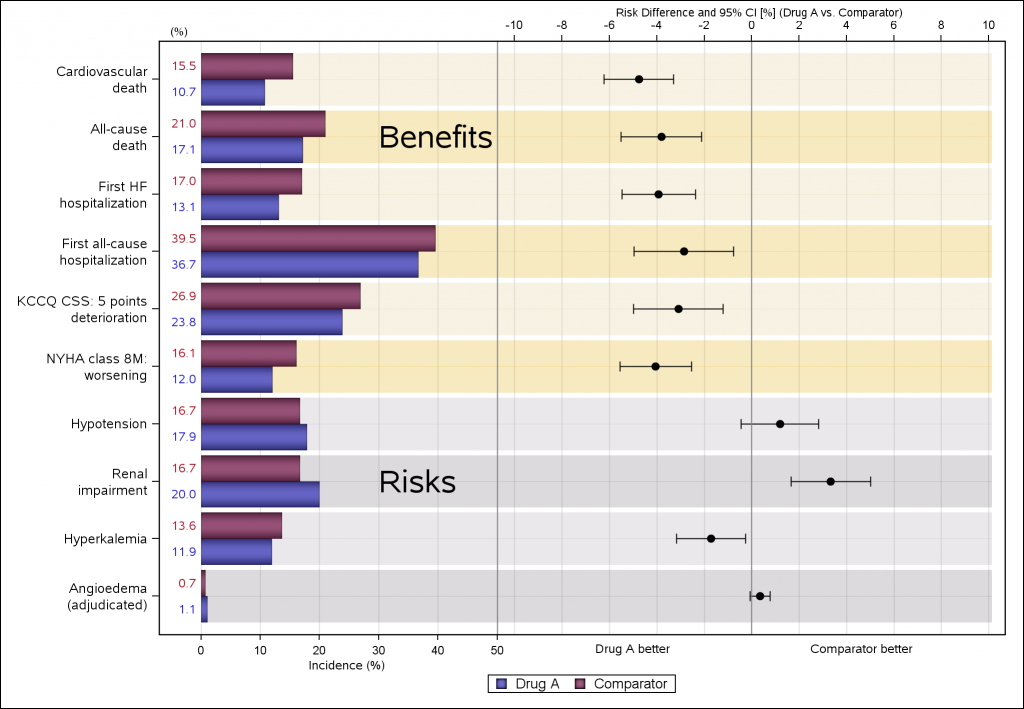
Is it possible to reproduce the attached graph with JMP?
Personally, I don't have much programming skills, however, since the JMP graphics are very defined, it would be a nice graphic to include in scientific publications.
Thank you
Giuseppe
4 REPLIES 4

Super User
- Mark as New
- Bookmark
- Subscribe
- Mute
- Subscribe to RSS Feed
- Get Direct Link
- Report Inappropriate Content
Re: New graph
You can make similar-looking graphs with Graph Builder without writing JSL. What aspects of the graph are important to you? (sizes, positions, colors, decorations, labels, statistics?)

The script GraphBuilder saved can be reused.
Graph Builder(
    Size( 839, 427 ),
    Show Control Panel( 0 ),
    Y Group Edge( "Left" ),
    Title Fill Color( "Medium Light Gray" ),
    Title Frame Color( "Medium Light Gray" ),
    Level Fill Color( {217, 217, 217} ),
    Level Frame Color( "Medium Light Gray" ),
    Level Spacing Color( "Medium Light Gray" ),
    Variables( X( :height ), X( :weight ), Y( :sex ), Group Y( :age ) ),
    Elements(
        Position( 1, 1 ),
        Bar(
            X,
            Y,
            Legend( 23 ),
            Packed Placement( "Separate stack" ),
            Summary Statistic( "% of Total" ),
            Label( "Label by Value" )
        )
    ),
    Elements(
        Position( 2, 1 ),
        Box Plot( X, Y, Legend( 25 ), Width Proportion( 0.3 ) )
    ),
    SendToReport(
        Dispatch(
            {},
            "graph title",
            TextEditBox,
            {Set Text( "Big Class Information" )}
        ),
        Dispatch(
            {},
            "Y title",
            TextEditBox,
            {Text Color( 0 ), Rotate Text( "Left" ), Font Color( 0 ), Set Text( "" )
            }
        ),
        Dispatch( {}, "Graph Builder", FrameBox, {Background Color( 36 )} ),
        Dispatch( {}, "Graph Builder", FrameBox( 2 ), {Background Color( 36 )} ),
        Dispatch( {}, "Graph Builder", FrameBox( 3 ), {Background Color( 68 )} ),
        Dispatch( {}, "Graph Builder", FrameBox( 4 ), {Background Color( 68 )} ),
        Dispatch( {}, "Graph Builder", FrameBox( 5 ), {Background Color( 36 )} ),
        Dispatch( {}, "Graph Builder", FrameBox( 6 ), {Background Color( 36 )} ),
        Dispatch( {}, "Graph Builder", FrameBox( 7 ), {Background Color( 67 )} ),
        Dispatch( {}, "Graph Builder", FrameBox( 8 ), {Background Color( 67 )} ),
        Dispatch( {}, "Graph Builder", FrameBox( 9 ), {Background Color( 35 )} ),
        Dispatch( {}, "Graph Builder", FrameBox( 10 ), {Background Color( 35 )} ),
        Dispatch( {}, "Graph Builder", FrameBox( 11 ), {Background Color( 67 )} ),
        Dispatch( {}, "Graph Builder", FrameBox( 12 ), {Background Color( 67 )} )
    )
);
Craige
Level II
- Mark as New
- Bookmark
- Subscribe
- Mute
- Subscribe to RSS Feed
- Get Direct Link
- Report Inappropriate Content
Re: New graph
Thanks for the reply and above all for the effort. The graph that is shown, however, is not the same as the one I had proposed. In your graph there are box plots, while in the graph that I would have liked there are confidence intervals and risks. Your graph is interesting, but not usable for research purposes where relative risks or odds ratios are analysed, etc.. Giuseppe

Staff
- Mark as New
- Bookmark
- Subscribe
- Mute
- Subscribe to RSS Feed
- Get Direct Link
- Report Inappropriate Content
Re: New graph
The risk difference plot is in JMP Clinical
JMP Systems Engineer, Health and Life Sciences (Pharma)
Level II
- Mark as New
- Bookmark
- Subscribe
- Mute
- Subscribe to RSS Feed
- Get Direct Link
- Report Inappropriate Content
Re: New graph
Thanks Byron_JMP,
not having JMP Clinical I never imagined that this possibility existed.
Thank you
Giuseppe
Recommended Articles
- © 2026 JMP Statistical Discovery LLC. All Rights Reserved.
- Terms of Use
- Privacy Statement
- Contact Us