Level: Intermediate
Stefan Nikles, Product Engineer, Analog Devices
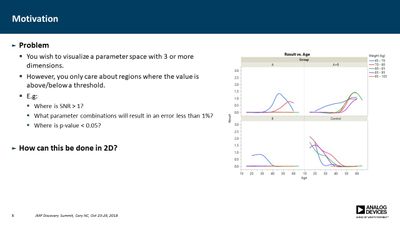
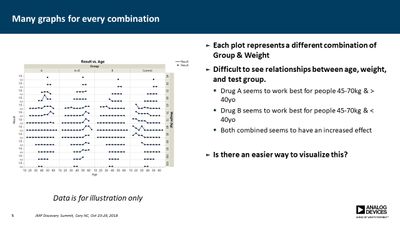
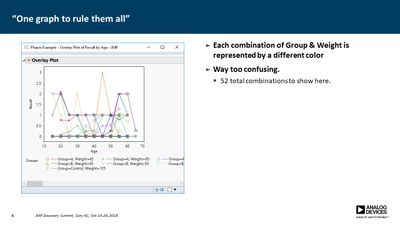
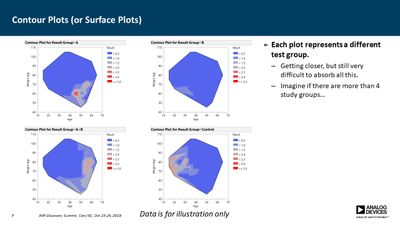
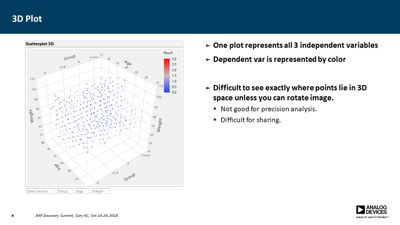
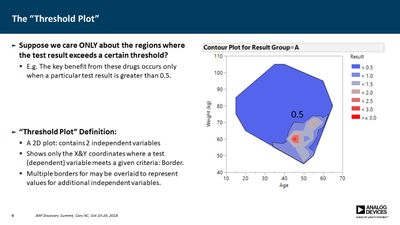
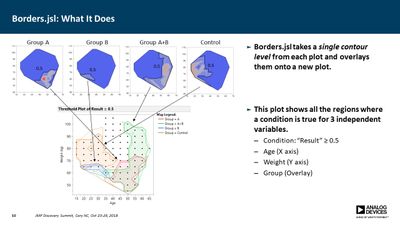
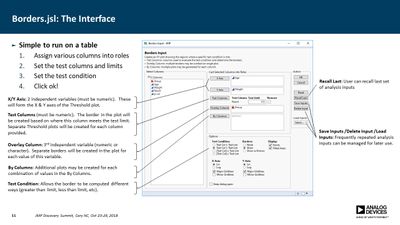
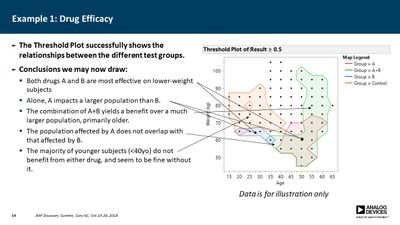
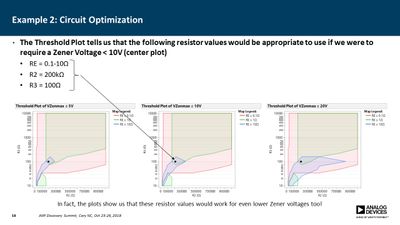
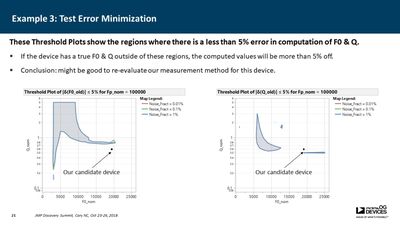
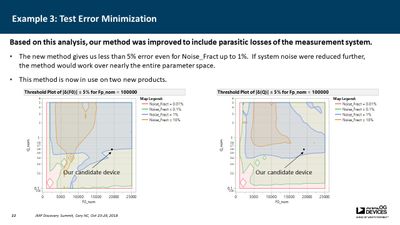
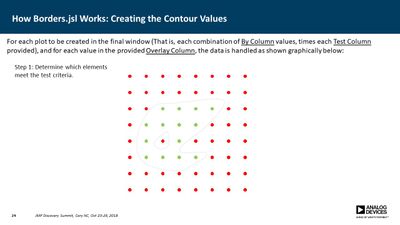
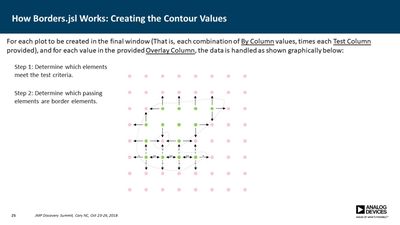
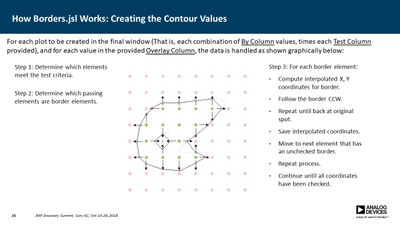
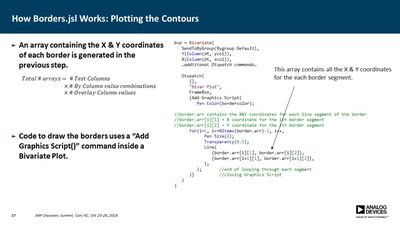
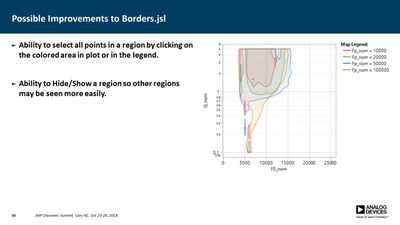
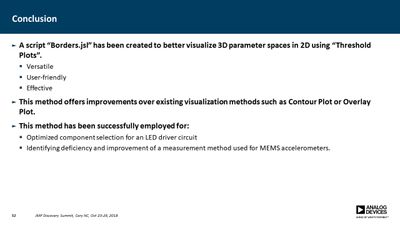
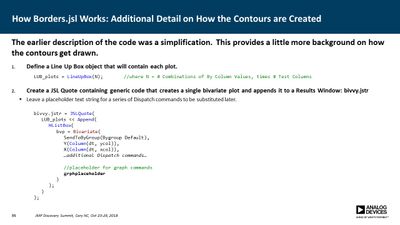
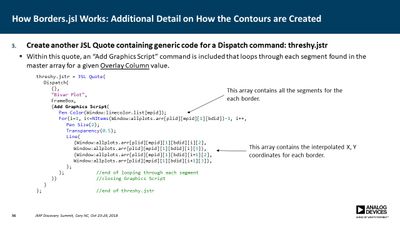
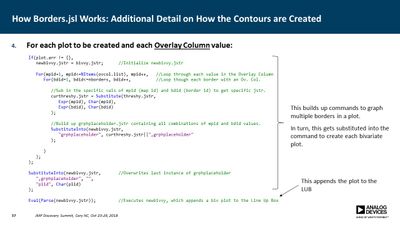
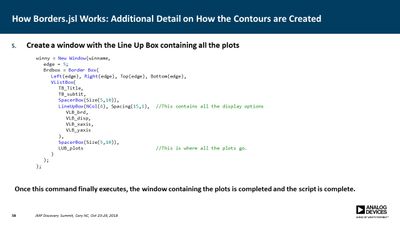
Several JMP platforms exist for visualizing parameter spaces: Contour Plot, Overlay Plot, Surface Plot and Scatterplot 3D, to name a few. These work well when exploring data containing a single dependent variable as a function of two independent variables, but it is more difficult when one needs to explore data as a function of three independent variables (e.g., a three-factor DOE). Users must commonly resort to presenting multiple plots for all values of one or more of the parameters, making it difficult to discern important relationships. In many cases, however, the primary concern is simply knowing where the dependent variable exceeds a specific threshold. For example, under what conditions does the signal-to-noise ratio exceed unity? Or where in the parameter space is the p-value less than 0.05? In this presentation, a method is described for computing a single contour level from multiple plots and overlaying each into a single plot. This method employs a GUI-enabled JSL script to compute the contours, which are then plotted using the Graphics Scripting feature within the Bivariate Platform. The use of this method was essential in validation of a new measurement technique for our devices.