- JMP User Community
- :
- Discussions
- :
- Re: JMP 17.2 > Variable Clustering > Algorithm and Output Display?
- Subscribe to RSS Feed
- Mark Topic as New
- Mark Topic as Read
- Float this Topic for Current User
- Bookmark
- Subscribe
- Printer Friendly Page
- Mark as New
- Bookmark
- Subscribe
- Mute
- Subscribe to RSS Feed
- Get Direct Link
- Report Inappropriate Content
JMP 17.2 > Variable Clustering > Algorithm and Output Display?
Hi JMP Community,
Windows 10 Pro, JMP 17.2
I am looking for an approach to display graphically the output of the Cluster Variable platform.
- I could recluster the variables using the general clustering platform and generate the associated dendrogram. However, I don't know which specific algorithm the Cluster Variables platform uses (Ward's method does not match the Cluster Variables output).
- I could potentially rebuild a dendrogram from the output of the Cluster Variable platform, but I must admit that I am unsure about the best approach to achieve this goal.
All suggestions are welcome.
Thank you.
Best,
TS
- Mark as New
- Bookmark
- Subscribe
- Mute
- Subscribe to RSS Feed
- Get Direct Link
- Report Inappropriate Content
Re: JMP 17.2 > Variable Clustering > Algorithm and Output Display?
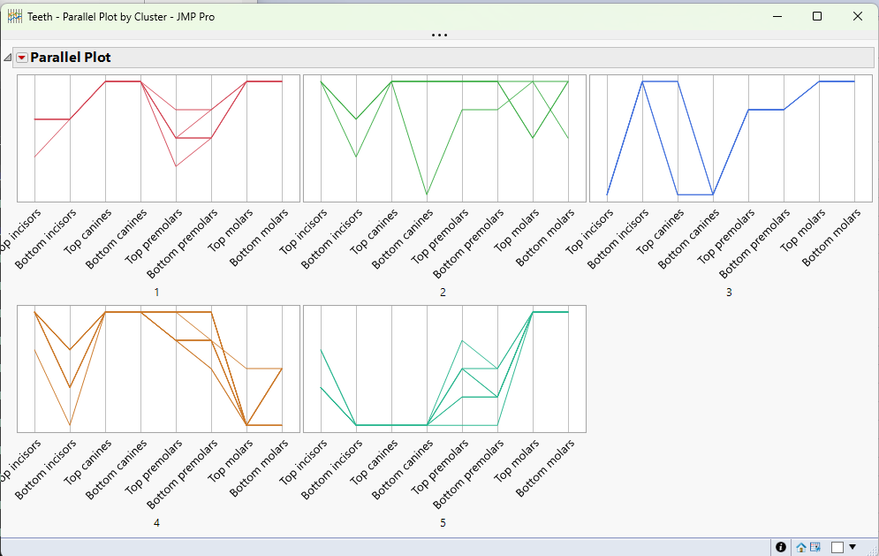
I'm not really certain what type of visualization you're looking for, but I like the Parallel Plots as a way to see the clusters. These are available in most (all?) of the clustering platforms, so you don't have to do it by hand. I've attached a data table with an example.
- Mark as New
- Bookmark
- Subscribe
- Mute
- Subscribe to RSS Feed
- Get Direct Link
- Report Inappropriate Content
Re: JMP 17.2 > Variable Clustering > Algorithm and Output Display?
Hi Jed,
Thank you for your answer. I am unsure how the Parallel Plot platform could be used on the Cluster Variable platform output, but I will explore it.
What I would like to achieve is to display the different clusters and their components as a dendrogram.
Thanks.
Best regards,
TS
- Mark as New
- Bookmark
- Subscribe
- Mute
- Subscribe to RSS Feed
- Get Direct Link
- Report Inappropriate Content
Re: JMP 17.2 > Variable Clustering > Algorithm and Output Display?
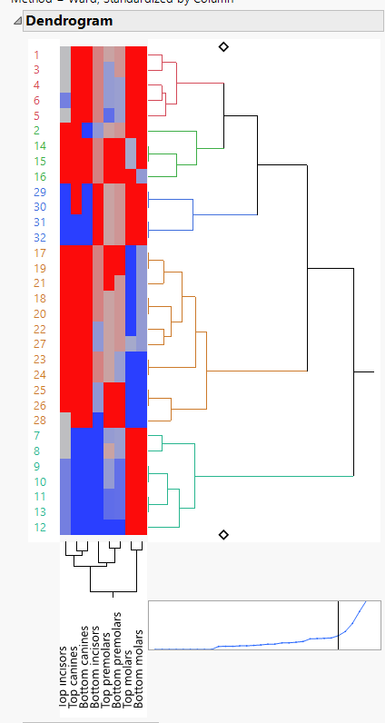
Ah, perhaps Red Triangle...Two Way Clustering would work for you. It shows the components (as colors) next to the dendrogram.
- Mark as New
- Bookmark
- Subscribe
- Mute
- Subscribe to RSS Feed
- Get Direct Link
- Report Inappropriate Content
Re: JMP 17.2 > Variable Clustering > Algorithm and Output Display?
Hi Jed,
Sorry for not explaining myself clearly. I am not talking about the Hierarchical or K Mean clustering platforms. I specifically referring to the CLUSTER VARIABLE platform. I am well aware of the multiple options in the Hierarchical or K Mean clustering platforms.
My questions are:
- What is the algorithm used by the CLUSTER VARIABLE platform
- Alternatively, how can I visualize (dendrogram) the relationship between clusters and members produced by the CLUSTER VARIABLE platform?
Thank you.
Best,
TS
- Mark as New
- Bookmark
- Subscribe
- Mute
- Subscribe to RSS Feed
- Get Direct Link
- Report Inappropriate Content
Re: JMP 17.2 > Variable Clustering > Algorithm and Output Display?
Hi Thierry,
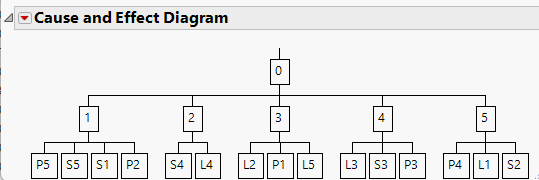
Sorry, I see that you were clear from the start about Cluster Variables platform, but I just wasn't reading properly. I found 2 ways to make an almost dendrogram, perhaps others in the community can improve these or provide better ideas. I started by making the Cluster Members table into a data table. The first method was a Diagram:
To force this into just one diagram instead of a separate one for each cluster, I added a '0' cluster to the bottom of the data table:
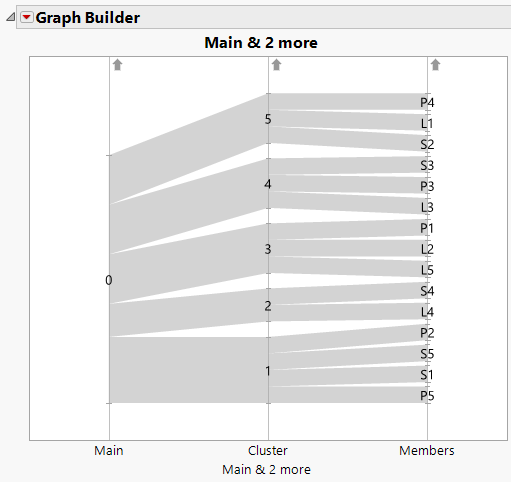
I also made something in Graph Builder:
To get this, I had to add a 'Main' column to the data table, and I had to create a manual Value Ordering sort order for the Members column.
I attached a data table, and I'm hoping others might have better ideas (perhaps graphing guru @scwise).
Thanks for helping me see what you're looking for.
Jed
- Mark as New
- Bookmark
- Subscribe
- Mute
- Subscribe to RSS Feed
- Get Direct Link
- Report Inappropriate Content
Re: JMP 17.2 > Variable Clustering > Algorithm and Output Display?
Have you read Statistical Details in the documentation for the Variable Clustering?
- Mark as New
- Bookmark
- Subscribe
- Mute
- Subscribe to RSS Feed
- Get Direct Link
- Report Inappropriate Content
Re: JMP 17.2 > Variable Clustering > Algorithm and Output Display?
Yes, but I may have missed the specific information I seek.
Specifically, I could not find the clustering algorithm used by the CLUSTER VARIABLE platform.
- © 2024 JMP Statistical Discovery LLC. All Rights Reserved.
- Terms of Use
- Privacy Statement
- About JMP
- JMP Software
- JMP User Community
- Contact


