A user once asked, can Tabulate show me the percentages of 2 groups,
say, No and Yes, across different categorical columns,
display the report with the No and Yes as column hearders, and the columns down as rows,
so I can see the percentages simultaneously ?
i.e., a table like this -
Yes, Tabulate can, very easily.
For this example, I am running JMP 12, using the data table Va Lung Cancer.jmp from the sample data library.
With 3 click-and-drags, I use tabulate to build a report as described.
How did I do it?
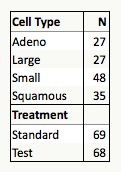
From the initial window, select and drag the columns of interest, and drop them to the Drop zone for rows.
For my example, I use the columns Cell Type and Treatment.
Since both are nominal columns, Tabulate creates 2 tables, concatenated vertically.
If you drop them to the Drop zone for columns, you will have 2 tables concatenated horizontally.
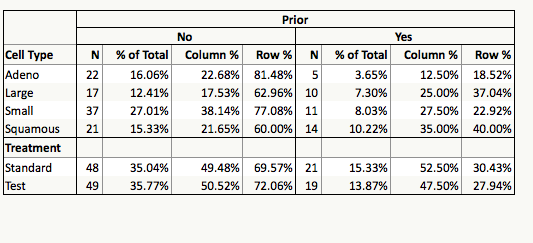
To further divide the population by the column "Prior",
drag the grouping column, and drop it on the box where "N" is.
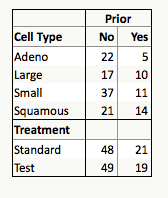
By default, you get the counts of the groups.
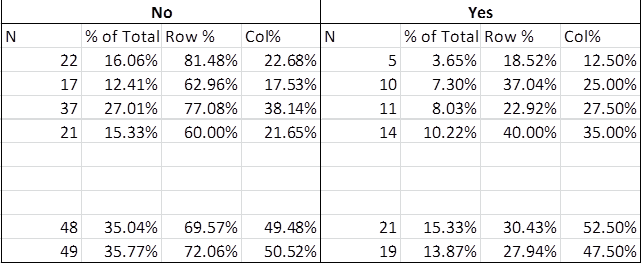
However, we want the table to show the count, column %, row % and % of total.
To do that, select the corresponding keywords from the list in the Control Panel,
drag the keywords and drop them near the bottom of the box for "No" and "Yes".
Dropping to the bottom edge is to let tabulate know that you want the statistics names to be lower in the hierarchy than the grouping column "Prior".
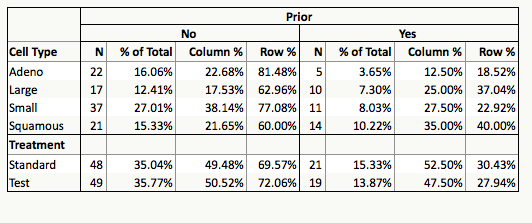
With 3 click-drag-drops, we created the above table.
You can append more tables to it, vertically or horizontally.
In tabulate, your report is always active.