Master List – Pictures from the Gallery – Advanced Graph Building Series
Scott Wise – Principal Systems and Statistical Engineer
Updated: 11/07/25
Pictures from the Gallery – Advanced Graph Building Series
Links, Snapshots, and Graphs Featured


- Custom Interval Area
- Ordered Bars with Color
- Flow Chart
- Broken Time Axis
- Reference Range & Text
- Marginal Chart
Pictures from the Gallery 2 (2017): https://community.jmp.com/t5/Discovery-Summit-2017/Pictures-From-the-Gallery-Two-Select-Advanced-Gra...

- Funnel Plot
- Waterfall Chart
- Curved Line Chart
- Table Squares
- Density Overlays
- Sankey Diagram
Pictures from the Gallery 3 (2018): https://community.jmp.com/t5/Discovery-Summit-2018/Pictures-From-the-Gallery-3-Select-Advanced-Graph...

- Two-Way Error Bars
- Likert Scale Bars
- Multi-Variate Bullet
- Trellised Heat Maps
- Packed Bar Pareto
- Volcano Plot
Pictures from the Gallery 4 (2019): https://community.jmp.com/t5/Discovery-Summit-Tucson-2019/Pictures-From-the-Gallery-4-Select-Advance...

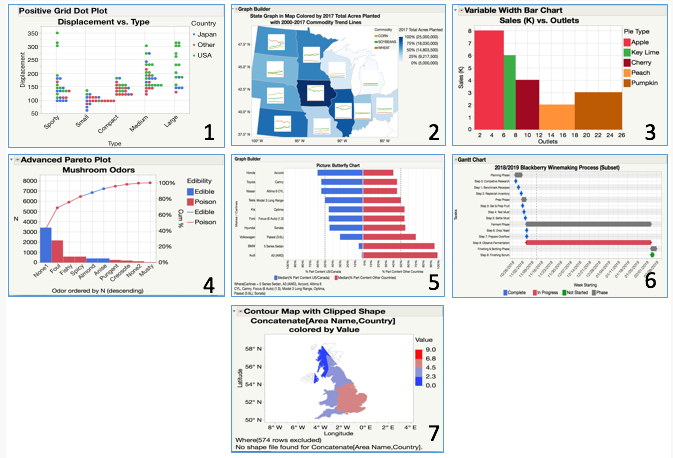
- Positive Grid Plot
- Graphs in Map
- Variable Width Bar Chart
- Advanced Pareto Plot
- Butterfly Chart
- Gantt Chart
- Clipped Contour Map
Pictures from the Gallery 5 (2020): https://community.jmp.com/t5/Discovery-Summit-Americas-2020/Pictures-from-the-Gallery-5-Select-Advan...

- Informative Box Plots
- Ridgeplot Densities
- Area Range Plots
- Informative Point Plots
- Bagplot with Outlier Boxes
- Components Effect Plot
Pictures from the Gallery 6 (2021): https://community.jmp.com/t5/Discovery-Summit-Americas-2021/Pictures-from-the-Gallery-6-Select-Advan...

- Hexagonal Map
- Map Cartogram
- Time Series
- Row Ordered Spirals
- HDR Box Plots
- Graphlets
Pictures from the Gallery 7 (2022): https://community.jmp.com/t5/Discovery-Summit-Americas-2022/Pictures-from-the-Gallery-7-Select-Advan...

- Dumbbell (Interval) Chart
- Word Cloud
- Moving Average Smoother Line Chart
- Point Cumulative Summary Chart
- Advanced Box Plots
- Wind Rose Chart
Pictures from the Gallery 8 (2023): https://community.jmp.com/t5/Discovery-Summit-Americas-2023/Pictures-from-the-Gallery-8-Innovative-G...

- Formula Based Graphs
- Tabular Data
- Flow Parallel Plots
- Forest Plots
- Percent of Factor Charts
- Satellite Mapping
Pictures from the Gallery 9 (2024): https://community.jmp.com/t5/Abstracts/Pictures-from-the-Gallery-9-Innovative-Graph-Builder-Views/ev...

- Super Plots
- Swim Lanes
- Overlay Encoding
- Survival At Risk Plots
- Page Grid
- Doughnut Plots
New: Pictures from the Gallery 10 (2025): https://community.jmp.com/t5/Abstracts/Pictures-from-the-Gallery-10-Innovative-Graph-Builder-Views-2...

- Smoother Constraints
- Overlaid Outlined Points
- Multiple Y Axis
- Bump Charts
- Vector Field Chart
- Curved Bar Charts