- New to JMP? Let the Data Analysis Director guide you through selecting an analysis task, an analysis goal, and a data type. Available now in the JMP Marketplace!
- See how to install JMP Marketplace extensions to customize and enhance JMP.
- Subscribe
- Mark as read
- Mark as new
Learn JMP Events
Events designed to further your knowledge and exploration of JMP.- JMP User Community
- :
- Learn JMP
- :
- Learn JMP Events
- :
- Re: Academic Webinar – Survey Analysis Fundamentals
Academic Webinar – Survey Analysis Fundamentals

Get JMP software free for academic use at jmp.com/student
Survey data is ubiquitous in social science, business, and healthcare research, and its analysis poses special considerations and challenges. This webinar reviews fundamental survey analysis techniques and how to implement them in JMP, including:
-
Preparing survey data for analysis (e.g., recoding response levels, handling multiple-response questions)
-
Creating custom cross-tabulation tables
-
Effectively visualizing and analyzing large groups of categorical responses
-
Mining information from free text responses
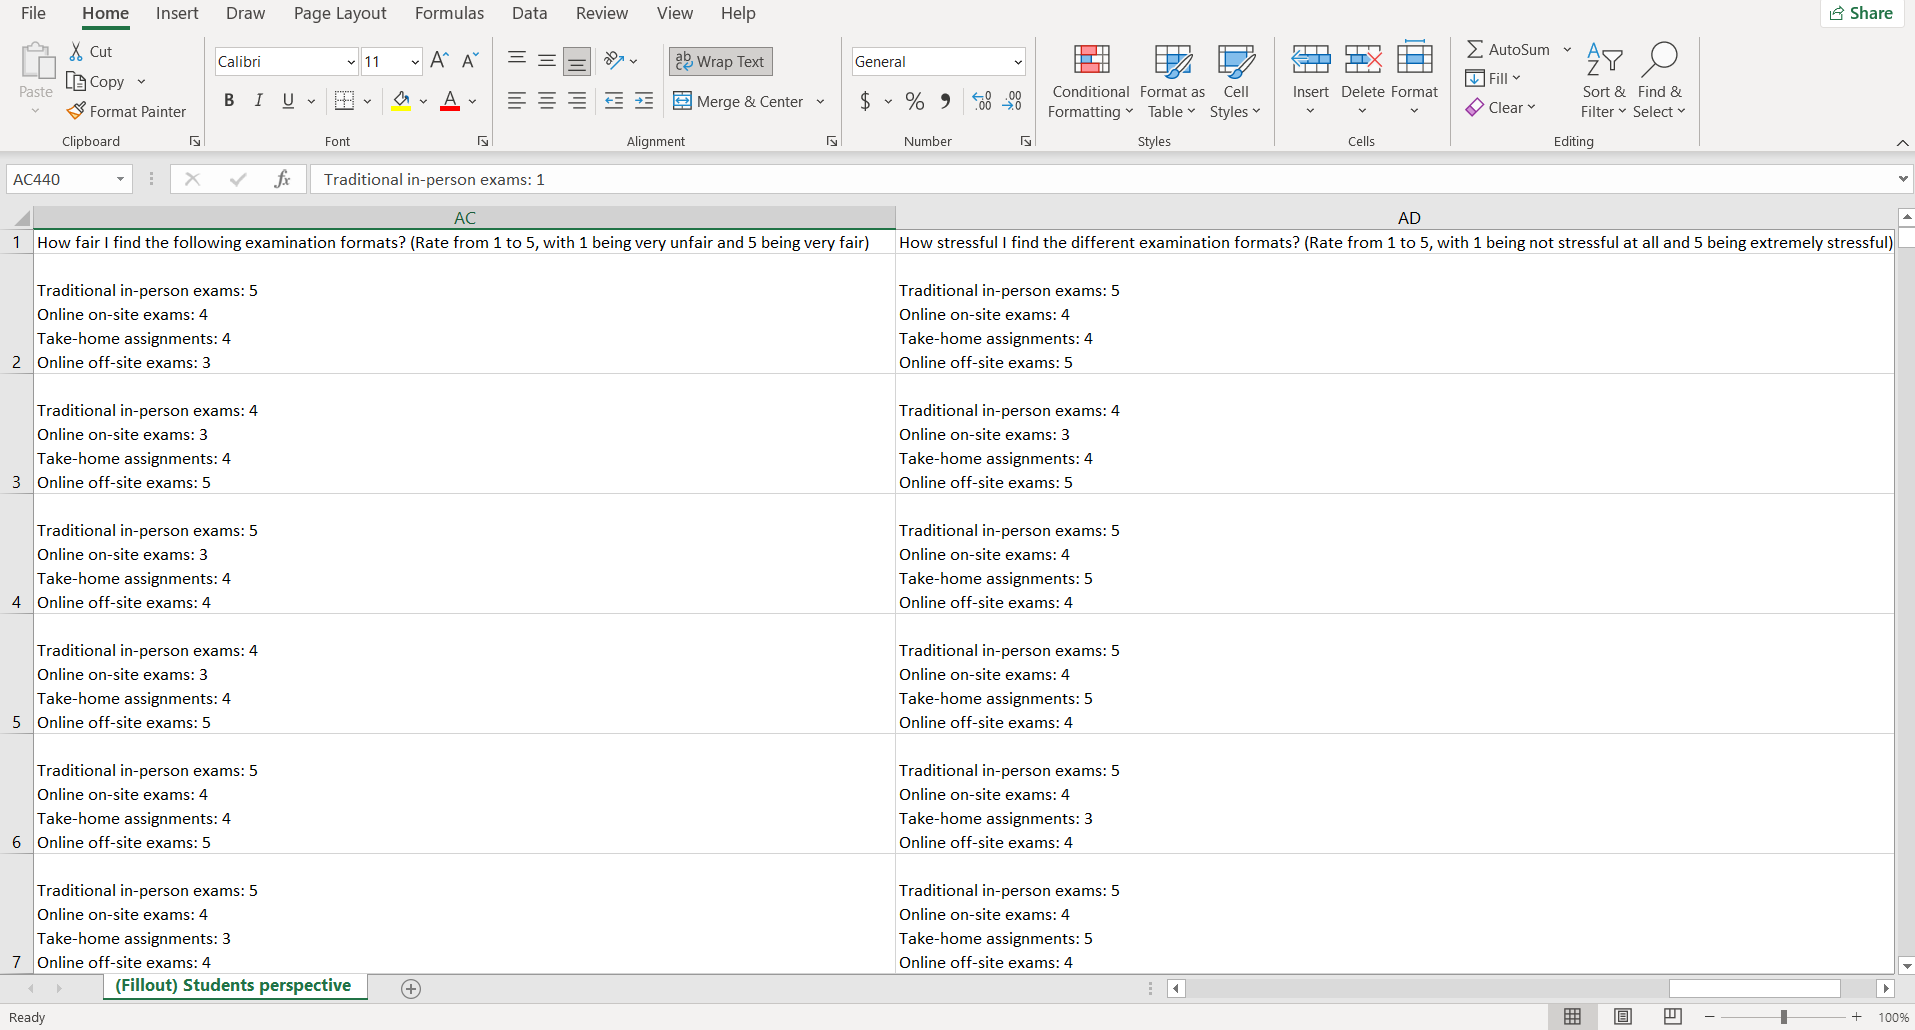
Hi, please with the attached picture to this comment, it's a situation where in a survey the respondent has to rate different types of methods. But all ratings are in a cell and I want to know how to make them independent so I can convert them to continuous variables.
@frankowa, that's not an ideal data format, but you can clean it up with JMP.
First, Import the Excel sheet, select each ratings column and then go to Cols > Utilities > Text to Columns. Check the NEWLINE box and click OK. You'll now have one column per rating item, though the item text (e.g. "Traditional in-person exams") will still be there.
We'll use Recode to extract just the numerical values and get rid of the text:
- Select all the new columns you just created, then go to Cols > Standardize Attributes.
- Click the Recode button.
- In the Recode tool, click the red triangle and go to Advanced > Extract Segment.
- Enter "2" as the Start Anchor and End Anchor to extract just the numerical values.
- Click OK to close Extract Segment and then Recode back in the Recode window.
Each rating item should now have all its numerical data in its own column as in the example data set I've attached.
JMP Academic Ambassador

can not see do not wachr
- © 2026 JMP Statistical Discovery LLC. All Rights Reserved.
- Terms of Use
- Privacy Statement
- Contact Us