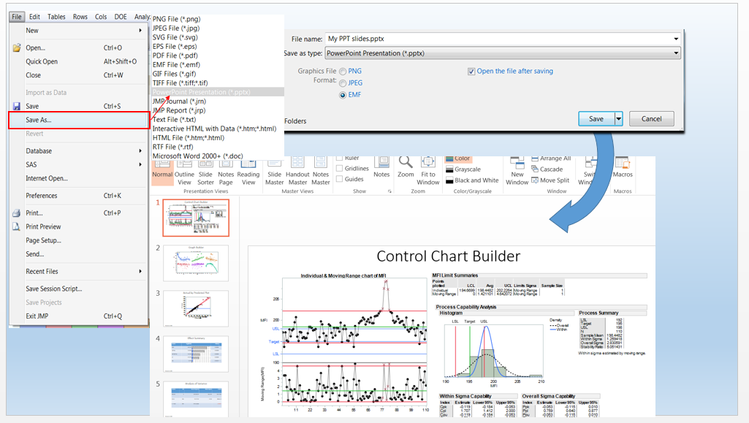
In a previous post titled “Saving graphs tables and reports in JMP,” I shared with you how to copy/paste JMP content into PowerPoint. Now I want to follow up by showing how you can export JMP reports directly in to the .pptx file format. The export writes graphs, tables, text and outline titles directly from JMP to PowerPoint.
Exporting to PowerPoint
If you use JMP on Windows: Click File > Save As…, select PowerPoint Presentation from the Save as type: drop-down menu, and save to the desired location.

If you use JMP on a Mac: Click File > Export…, select the Microsoft PowerPoint option, click Next, and save to the desired location.
Some things to know about this:
- Each element (i.e., graphic or table) of the report is placed on a separate slide.
- Table contents are editable within PowerPoint.
- Once content is in PowerPoint, you can update styles, move content around and better incorporate your own content.
Changing the Template Background
PowerPoint supplies most of the visual styling such as table colors, fonts, title size, etc., based on the template used. JMP ships with a default template. If you have a company standard template (or theme), you can easily change it by going to the Design tab in PowerPoint.
Editable Graph Builder.pptx