cancel
Showing results for 
Show  only  | Search instead for 
Did you mean: 
Check out the JMP® Marketplace featured Capability Explorer add-in
Choose Language Hide Translation Bar
sseligman
Staff
How to overlay histograms in JMP

There are two methods to overlay histograms in JMP, using the Distribution and Graph Builder platforms. You might want to overlay histograms to review the similarities and/or differences between the distributions of two or more variables. Overlaying the histograms allows you to compare the distributions in a more precise manner than viewing them separately.

Overlaying histograms using Distribution

The first method uses the Distribution platform. Below is an example using the Car Physical Data.jmp sample data table. In addition to overlaying histograms, normal distribution curves are overlayed in this example. If you do not desire distributional curves in your graph, simply disregard the related steps. The structure of Car Physical Data, which has a total of 116 rows, is as follows:


datatable.JPG


From the data table, go to Analyze > Distribution. Place two numeric, continuous columns, say Displacement and Horsepower, in the Y, Columns box and click OK.

The output will look like the following (I’ve removed some of the default output sections, like Quantiles and Summary Statistics, for simplicity):


distributions1.JPG


If you see the histograms side by side instead of on top of one another, click on the red triangle menu next to Distributions and select Stack to see them as they are in the above image. If the histograms appear in a vertical format, click on the red triangle menus next to each variable name and choose Display options > Horizontal Layout. Another option is, rather clicking on each individual red triangle menu, to press the Ctrl key while making the change for one variable. By doing this, the change broadcasts across all other variables.

As I mentioned above, I’m going to fit a normal curve to each distribution and overlay those elements as well.

To produce the normal curves, hold the Ctrl key and click (Command + click on a Mac) on the red triangle menu next to Displacement. Then, choose Continuous Fit > Normal. A Fitted Normal distribution appears in the output for both variables, as seen below. 
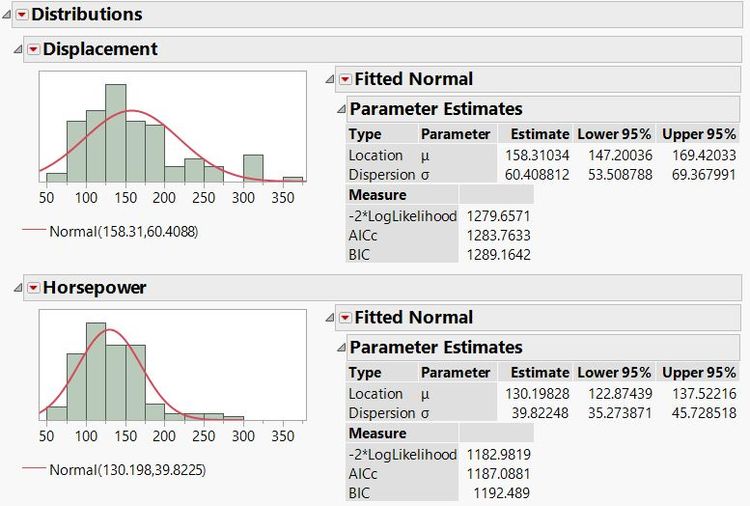
 

distnormalcurves.JPG


Now, I’ll go ahead and customize the colors of the elements in each plot so we can distinguish them in the final result. I will use red for Displacement and blue for Horsepower. Right click within the Displacement histogram and choose Customize. In the item list in the window that appears, click Histogram. Change the Fill Color to red and the Transparency to 0.5 (so we can more easily observe where the histograms overlap). The Customize Graph window appears as follows:
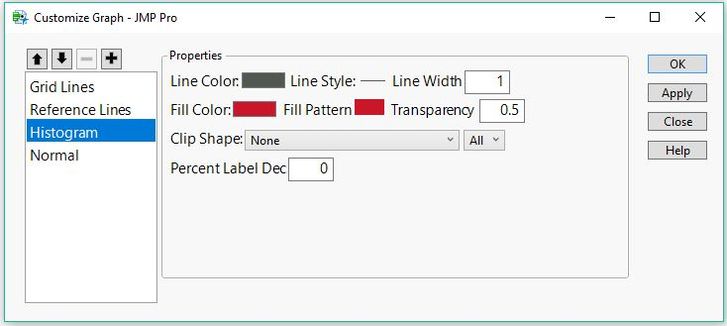
 

customize.JPG


In the case for Displacement, the normal curve is already red, so we do not need to customize that item. Click OK to close the window.

Now, repeat the previous steps to change the Horsepower histogram color to blue and the transparency to 0.5. We want to change the normal curve to be blue as well, so click on the Normal line item and change the Line Color field to blue. Click OK.

Our output now looks like this:
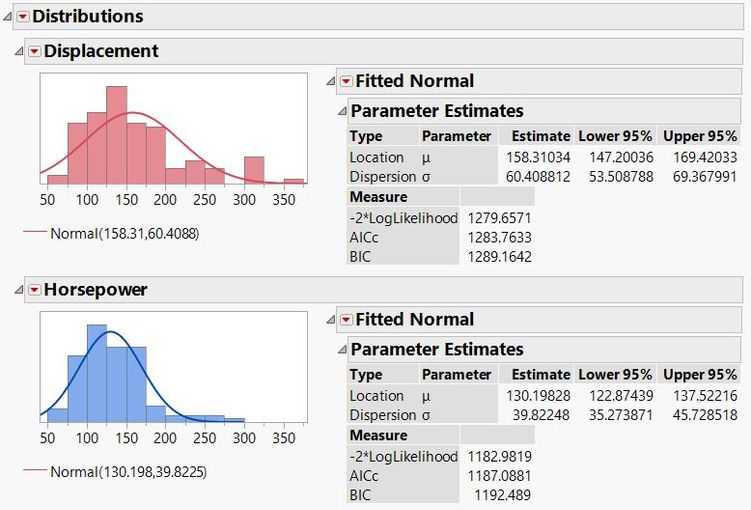
 

curveswithcolors.JPG


Now, I’ll copy the Displacement histogram and normal curve onto the Horsepower plot so they are overlayed.

To do this, first right click within the Displacement histogram and choose Edit > Copy Frame Contents. Next, right click within the Horsepower histogram graph and choose Edit > Paste Frame Contents. You may have to adjust the axis range in view to see both complete histograms.

The result is both histograms and normal curves in one graph:


onegraphJPG.JPG


With this method, there is no automatic legend, but you can use the Annotate  tool to add text and the Line tool to add a colored line element for a manual legend.

After implementing these tools, my result is something like this:


withlegend.JPG


Overlaying histograms using Graph Builder

The second method to overlay histograms (and distribution curves) uses the Graph Builder platform.

This method requires the data to be in a stacked format so that all continuous values are in one column. To stack the data, go to the Tables menu from the original Car Physical Data table and choose Stack. Place both Displacement and Horsepower in the Stack Columns box. Click OK.

The new stacked data table has a column named Data that contains all data values, and a column named Label that indicates whether that value originated from the Displacement column or the Horsepower column.

From the stacked data table, go to Graph > Graph Builder. Drag Data to the X role and Label to the Overlay role. Right click within the graph and choose Points > Change to > Histogram.

Now, we need to make sure the plot is scaled correctly. I’ll go back to the overlayed plot in the Distribution platform and click on the red triangle menu > Histogram Options > Density Axis. This axis gives us an idea of what the Graph Builder Y axis should be. An axis appears on the right side of the histogram, and I double-click on it to open the Axis Settings window. The maximum value in this case is 0.0117586.

Now, go back to the Graph Builder output, drag the Data column to Y and double click the axis to open Y Axis Settings. Set the minimum to 0 and the maximum value to 0.0117586, to mimic the density axis from the Distribution platform. I also set the increment to 0.002, and the Dec (decimal) field in the Format section to 3.

If desired, you can double click on the X axis to open its Axis Settings dialog and customize the minimum, maximum, and increment values. The result at this point is this:

datavsdata.JPG


Next, I will overlay the normal curves. First, we’ll need to record the mean and standard deviation values from the fitted normal distributions applied to both Displacement and Horsepower in the Distribution platform. Recall that these values are given in the output after selecting Continuous Fit > Normal.

Recall the values (outlined in red) from the Distribution output below:

 musigmavalues.png


With these values recorded, right click within the Graph Builder plot and select Customize. Click on the + icon to add a custom script. We’ll use the syntax below for each normal curve. The Pen Color statement defines the color of the curve while the Y Function draws a normal density curve with specified mu and sigma parameters (recorded from the Distribution output for each variable).


Pen Color( "<color>" );
Y Function( normal density(x, mu, sigma), x );

Using the syntax above and the (rounded) mu and sigma values for the fitted Normal distribution applied to Displacement and Horsepower, I enter the following text into the custom script window.


//Horsepower
Pen Color( "blue" );
Y Function( Normal Density( x, 130.198, 39.8225 ), x );
//Displacement
Pen Color( "red" );
Y Function( Normal Density( x, 158.31, 60.4088 ), x );

Click OK. The result is this:

datavsdata_withcurves.png


Now, I’ll make a few customizations to finalize the graph to my preferences. I prefer to remove the graph label, the Y axis label, as well as the X axis label. I’ll double click in each field and use the delete key to remove the text. Also, I don’t want to show any tick labels on the Y axis. I double click on the axis to open Y Axis Settings and uncheck the Labels checkbox for major tick marks in the Axis Label Row section of the dialog. Also, I want to move the legend inside the graph. I click on the red triangle menu next to Graph Builder and choose Legend Position > Inside Right. Lastly, I’ll extend the range of the x-axis slightly for a more complete picture. I open X Axis Settings and set the minimum as 0 and the maximum as 400.

Finally, I click on the Done button and am left with the following graph:
finalGB.JPG


The above examples show how to overlay histograms and normal curves using two methods – the Distribution platform and the Graph Builder platform in JMP. If desired, this example can be generalized to overlay more than two histograms and normal curves, or fit other distributional curves to your data.

Last Modified: Jul 26, 2018 2:45 PM
Comments
Lirpsa
Level I

This is *exactly* what I want to do, but unfortunately the instructions for the "graph builder" option are not working. 


I have pulled up the sample data set, stacked the columns as instructed, and followed along exactly and it works fine until I get to the instructions to drag the "Label" column into the "Overlay" role.  When I do that, nothing changes in the graph.  I still see a histogram, but all the data is lumped together, not separated out into 2 overlaid color groupings like the author's illustration.  What is going on here?  I am running JMP 11.2.0.  


This is a screen capture of the window:

GraphBuilder ScreenCap.JPG


Thank you!

sseligman
Staff

Hi Lirpsa,


Thank you for bringing this to our attention. You are correct -- the Overlay role in JMP 11's Graph Builder does not distinguish color for the Histogram element. If you have a site license, you can contact us in Technical Support (support@jmp.com) and we can help you upgrade to the current version, JMP 14.2. If you have a single-user license of JMP 11, this doesn't include major version upgrades. In that case, feel free to contact our JMP sales department at 877-594-6567.


Lirpsa
Level I

Thank you so much for replying, and confirming that I'm not just missing some dumb detail.  I do have a site license.  I will ask my on-site folks first if I can upgrade to ver14.2.  Thank you!

sseligman
Staff

You are welcome, Lirpsa! Your site representative will indeed be able to assist you in the upgrade. If an order for v14 has not yet been processed for your site, the site representative can request an upgrade at www.jmp.com/upgrade.

PatrickGiuliano
Staff

@sseligman this is great!  thanks for sharing all of this.  I do think this is at the core of statistical discovery and JMP should integrate this in a more automatic way (either as part of distribution platform or as part of graph builder platform) in a future release of JMP.  other softwares like Minitab will allow you to overlay histograms and compare densitities with a few mouse clicks.  


i've done something similar in graph builder many times in the past but always with some difficulty and many mouse clicks. I really like your custom script implementation and the idea of "copy-pasting frame contents."

Steven
Level I

I too wish JMP would automate comparing mulitiple distributions.  This is a core comparision for semiconductor IC test results by wafer or assembly lot and I am sure many others have similiar needs.  Quantix makes this an easy drag and drop process and even allows for multiple Upper and Lower Limits.  My peer across the hall laughs at me as I click and click to draw the comparison.

PatrickGiuliano
Staff

@Steven I totally agree with you... maybe if we vote on it enough it will get incorporated?  One other basic thing which JMP sorely needs is the ability to automate changing the scale on the histograms in the Distribtion Platform to vertical (vs horizontal) so you can actually read the numbers clearly.  I think Graph Builder is a great place to have this functionality that you/we are talking about.  In a similar way as when you profile the regression relationship and have options to turn on r-squared, equation, etc with check-boxes (or another example is 4-number summary with Box Plots), this can be a similar feature in graph builder.  In fact, graphing hisograms in general could be vastly improved in Graph Builder, to more closely mimic the visual friendliness of the Distribution Platform.  I find myself constantly using hte Grabber tool to resize my distribution graphs if/when I endeaver to make them in Graph Builder. 


@XanGregg I'm copying you here on this one!  Great to meet you at the 2019 JMP Tucson discovery summit today!  (10/18/2019)

XanGregg
Staff

Hey Patrick, 


Yes, the JMP Wish List is a good way to go so others can chime in.


Since I'm just catching up with this thread, can you summarize what the request is? I'm seeing requests for overlaid histograms in Distribution and for options for more diagnostic/summary numbers in Graph Builder.

PatrickGiuliano
Staff

Hi @XanGregg Greg, Thanks for the reminder about the JMP Wish List, I will add it there! 


Regarding summarizing the request it is basically this:  


1. In a very similar way that JMP performs univariate analysis and presents histograms/summary statistics using Analyze>Distribution, enable JMP, in the Graph Builder Platform, to overlay at least two distributions, fit a normal distribution curve to each distribution individually, and automatically compute a proportion of area overlap between the two distributions.  See the attached image:


image 1.png

2. Note there have been various good contributions on the user community in this direction in addition to this wonderful post by @sseligman  - This courtesy of @ms , https://community.jmp.com/t5/Discussions/is-there-a-way-to-find-the-area-common-to-two-different-nor... where they created their own JSL to perform this operation.

I attach the script here for conveniece:   In the end, the most desired one would be what I am describing above, and what is being computed and illustratred schematically with the JSL below.  

Names Default To Here(1);

// Define curves and calculate overlap area

mean1 =  5.28;
stdev1 = 0.91;

mean2  = 8.45; 
stdev2 = 1.36; 

N1 = Expr(Normal Density(x, mean1, stdev1));

N2 = Expr(Normal Density(x, mean2, stdev2));

ovl = Integrate(Min(N1, N2), x, ., .);

Show(ovl);

//––––––––––

// Illustration

ym = xm = (-1000 :: 1000) / 100;

For(i = 1, i <= N Col(xm), i++,

    ym[i] = Min(Normal Density(xm[i], mean1, stdev1), Normal Density(xm[i], mean2, stdev2))

);

New Window("Overlap Coefficient",

    y = Graph Box(

        Y Scale(0, 1),

        X Scale(-5, 12),

        Y Function(N1, x);

        Y Function(N2, x);

        Text({0, 0.6}, "OVL% = ", ovl*100);

        Fill Color(1);

        Polygon(xm, ym);

    )

);

@Steven I hope this fully captures it for you as well?

DecileDromedary
Level I

Thanks! it worked really very well to overlay two Normal distributions on each other, with the color differences!

Given the chance, I would like to save the script with these features in the data table. 

Is it possible?

PatrickGiuliano
Staff

Hi @DecileDromedary Sure! Using the Graph Buidler approach, after you're done making all of the customizations, you can to go the to the red triangle menu and select Save Script > To Data Table: 

PatrickGiuliano_0-1683796935592.png

JMP will produce a script (in my example, named "Data vs Data") and write it to the data table where you can access it in the upper left-hand corner by clicking the green play button next to the script name:


PatrickGiuliano_1-1683797007078.png

Here is what that saved data table script might look like (I generated this in JMP 17.1):

Graph Builder(
	Variables( X( :Data ), Y( :Data ), Overlay( :Label ) ),
	Elements( Histogram( X, Y, Legend( 4 ), Response Scale( "Fill" ) ) ),
	SendToReport(
		Dispatch(
			{},
			"Data",
			ScaleBox,
			{Format( "Best", 12 ), Min( 4.68939393939394 ), Max( 365.833333333333 ),
			Inc( 100 ), Minor Ticks( 1 )}
		),
		Dispatch(
			{},
			"Data",
			ScaleBox( 2 ),
			{Format( "Fixed Dec", 12, 3 ), Min( 0 ), Max( 0.0107369299221357 ),
			Inc( 0.002 ), Minor Ticks( 1 ), Label Row(
				{Automatic Font Size( 0 ), Automatic Tick Marks( 0 ),
				Label Orientation( "Horizontal" )}
			)}
		),
		Dispatch(
			{},
			"Graph Builder",
			FrameBox,
			{Add Graphics Script(
				5,
				Description( "" ), //Horsepower
				Pen Color( "blue" );
				Y Function( Normal Density( x, 130.198, 39.8225 ), x );
//Displacement
				Pen Color( "red" );
				Y Function( Normal Density( x, 158.31, 60.4088 ), x );
			), DispatchSeg( Hist Seg( 1 ), Bin Span( 4, 0 ) ),
			DispatchSeg( Hist Seg( 2 ), Bin Span( 4, 0 ) )}
		)
	)
)


DecileDromedary
Level I

@PatrickGiuliano  Thanks a lot!, Its a good idea to use Graph builder too.

, inorder to match my problem statement, I wanted to save the features we generated in the Distributions tab, the histogram, Normal curve along with the Normal Quantile plot. After the step that we use copy frame contents and paste frame contents with colour differences.


Thanks again!


DecileDromedary
Level I

@PatrickGiuliano for something like this :

DecileDromedary_1-1683800790997.png

Thanks!

PatrickGiuliano
Staff

Hi @DecileDromedary You're welcome! Unfortunately, I don't think this workflow is easily reproducible (in JMP-generated script), even with JMP's recent Enhanced Log (JMP 16) and Workflow Builder (JMP 17).  Of course, there may be way to script this in JSL from scratch but that would be a lot more work (beyond scope here).


Can you please add commentary (similar to the above) regarding your request to the following Wish List post?  

https://community.jmp.com/t5/JMP-Wish-List/Support-for-overlaying-multiple-distributions/idi-p/35924...


Your ask is similar to what is being requested there, see the screen capture there from @shampton82:

PatrickGiuliano_0-1683822082423.png


If a plot like the above were built into Distribution or Fit Y by X, then you could save that script to your data table just like I showed in Graph Builder.

This will help us consider your request as a feature enhancement in Graph Builder in a future release of JMP.

DecileDromedary
Level I

@PatrickGiuliano :

I am trying to deploy the script for ovl coefficient. I tried it on a random data and it works wonderfully! Thank you. But,  as a next step I tried to get the values automatically into the script.


Names Default To Here(1);

// Define curves and calculate overlap area

mean1 =  5.28;
stdev1 = 0.91;

mean2  = 8.45; 
stdev2 = 1.36; 

N1 = Expr(Normal Density(x, mean1, stdev1));

N2 = Expr(Normal Density(x, mean2, stdev2));

ovl = Integrate(Min(N1, N2), x, ., .);

Show(ovl);


Just that i need the script to read mean1, Std dev 1 and mean2, std. dev 2 directly from the columns instead of manually entering it into the script everytime.

I tried many ways:

trial 1: mean = mean(column(dt, one_col )[sel_rows])

trial 2: Col Mean(name, <By var, ...>)


If there are ways, please let me know . Thanks!

PatrickGiuliano
Staff

Hello @DecileDromedary,


Here is an example with Big Class. I took a different approach (more table-based and less JSL scripty).  For some reason I had to standardize the data because the Integrate function was taking forever to evaluate otherwise (apparently causing JMP to enter a nonterminating process, i.e. (Not Responding)).


Names Default To Here( 1 );
dt = Open( "$SAMPLE_DATA/Big Class.jmp" );

// New formula column: Standardize[height]
Data Table( "Big Class" ) << New Formula Column(
	Operation( Category( "Distributional" ), "Standardize" ),
	Columns( :height )
);


// New column: mean Std height by sex
Data Table( "Big Class" ) << New Column( "mean Std height by sex",
	Numeric,
	"Continuous",
	Format( "Best", 12 ),
	Formula( Col Mean( :"Standardize[height]"n, :sex ) )
);

// New column: stdev height by sex
Data Table( "Big Class" ) << New Column( "stdev Std height by sex",
	Numeric,
	"Continuous",
	Format( "Best", 12 ),
	Formula( Col Std Dev(:"Standardize[height]"n, :sex ) )
);

// → Data Table( "Big Class By (sex)" )
dt2 = Data Table( "Big Class" ) << Summary(
	Group( :sex ),
	Mean( :mean Std height by sex ),
	Mean( :stdev Std height by sex ),
	Freq( "None" ),
	Weight( "None" ),
	statistics column name format( "column" )
);

// Define curves and calculate overlap area

mean1  = dt2[1,3]; //female	 
stdev1 = dt2[1,4]; 	

mean2  = dt2[2,3]; //male  
stdev2 = dt2[2,4];  


N1 = Expr(Normal Density(x, mean1, stdev1));
N2 = Expr(Normal Density(x, mean2, stdev2));

ovl = Integrate(Min(N1, N2), x, ., .);

Show(ovl);

//––––––––––

// Illustration

ym = xm = (-1000 :: 1000) / 100;
For(i = 1, i <= N Col(xm), i++,
    ym[i] = Min(Normal Density(xm[i], mean1, stdev1), Normal Density(xm[i], mean2, stdev2))
    	
    );

New Window("Overlap Coefficient",
    y = Graph Box(
        Y Scale(0, 1),
        X Scale(-5, 12),
        Y Function(N1, x);
        Y Function(N2, x);
        Text({0, 0.6}, "OVL% = ", ovl*100);
        Fill Color(1);
        Polygon(xm, ym);

    )

);

/*## ## ## */
// Close Data Table: Big Class By (sex)
Close( dt2, NoSave );
//hide Big Class
dt << Show Window(0);

Hope it helps! 


P.S. Sorry I missed this. In the future to ensure you get a timelier response, please post your question on the general discussion forum, you can include a link to this post with your question and our community of very knowledge and experienced users should be able to guide you very quickly (and more adeptly than I can with JSL).  Also, if you are a licensed JMP user, you can also submit your questions to support@jmp.com -- we offer support in many situations including for questions like this one.


Cheers,

@PatrickGiuliano (JMP Technical Support)

francois_berger
Level III

hi,

thanks for the tip, it works

some customers are interested by overlay histograms with densities for routine analysis

Do you think that an option could be added in the graph builder to add the densities without JSL?

PatrickGiuliano
Staff

@francois_berger Thanks for your interest and suggestion!


Please consider Fit Oneway (Fit Y by X, with a Continuous Y versus a Categorical X) since you can generate a similar plot to what you are after (Compare Densities)

https://www.jmp.com/support/help/en/17.2/#page/jmp/example-of-the-densities-options.shtml#ww854340


For adding the desired functionality to Graph Builder, the JMP Wishlist is a good place to make your suggestion: https://community.jmp.com/t5/JMP-Wish-List/idb-p/jmp-wish-list.  Here is the Wishlist Post where others have expressed similar interest:  https://community.jmp.com/t5/JMP-Wish-List/Support-for-overlaying-multiple-distributions/idi-p/35924....  Can you please post your comment/s there? (it also helps if you provide the context/ motivation as described on the Main Wishlist Page I liked above). In general, more interest gives us better context so our Product Mgmt and Software Dev teams can consider it carefully. 


One thing to keep in mind though is that if you are interested in something like area overlap (%), I am told by our development team that this sort of implementation can be quite tricky in Graph Builder, so something like a custom script or JMP add-in would better meet this need.  Like what is suggested here:  https://community.jmp.com/t5/JMP-Wish-List/Support-for-overlaying-multiple-distributions/idi-p/35924...

hogi
Level XII

If it's just about a nice looking curve without a Gaussian Fit, one can use histograms 2x with Bar and Density setting.
The two Overlap Settings can be used to fine tune the heights.

Unlocking the Power of Graph Builder 2024 @ 20min


hogi_0-1724432235083.png


Open( "$SAMPLE_DATA/Big Class.jmp" );
Graph Builder(
	Size( 442, 271 ),
	Show Control Panel( 0 ),
	Variables( X( :height ), Y( :sex ), Overlay( :sex ) ),
	Elements(
		Histogram(
			X,
			Y,
			Overlap( 5 ),
			Histogram Style( "Kernel Density" )
		),
		Histogram( X, Y, Overlap( 5 ) )
	)
);