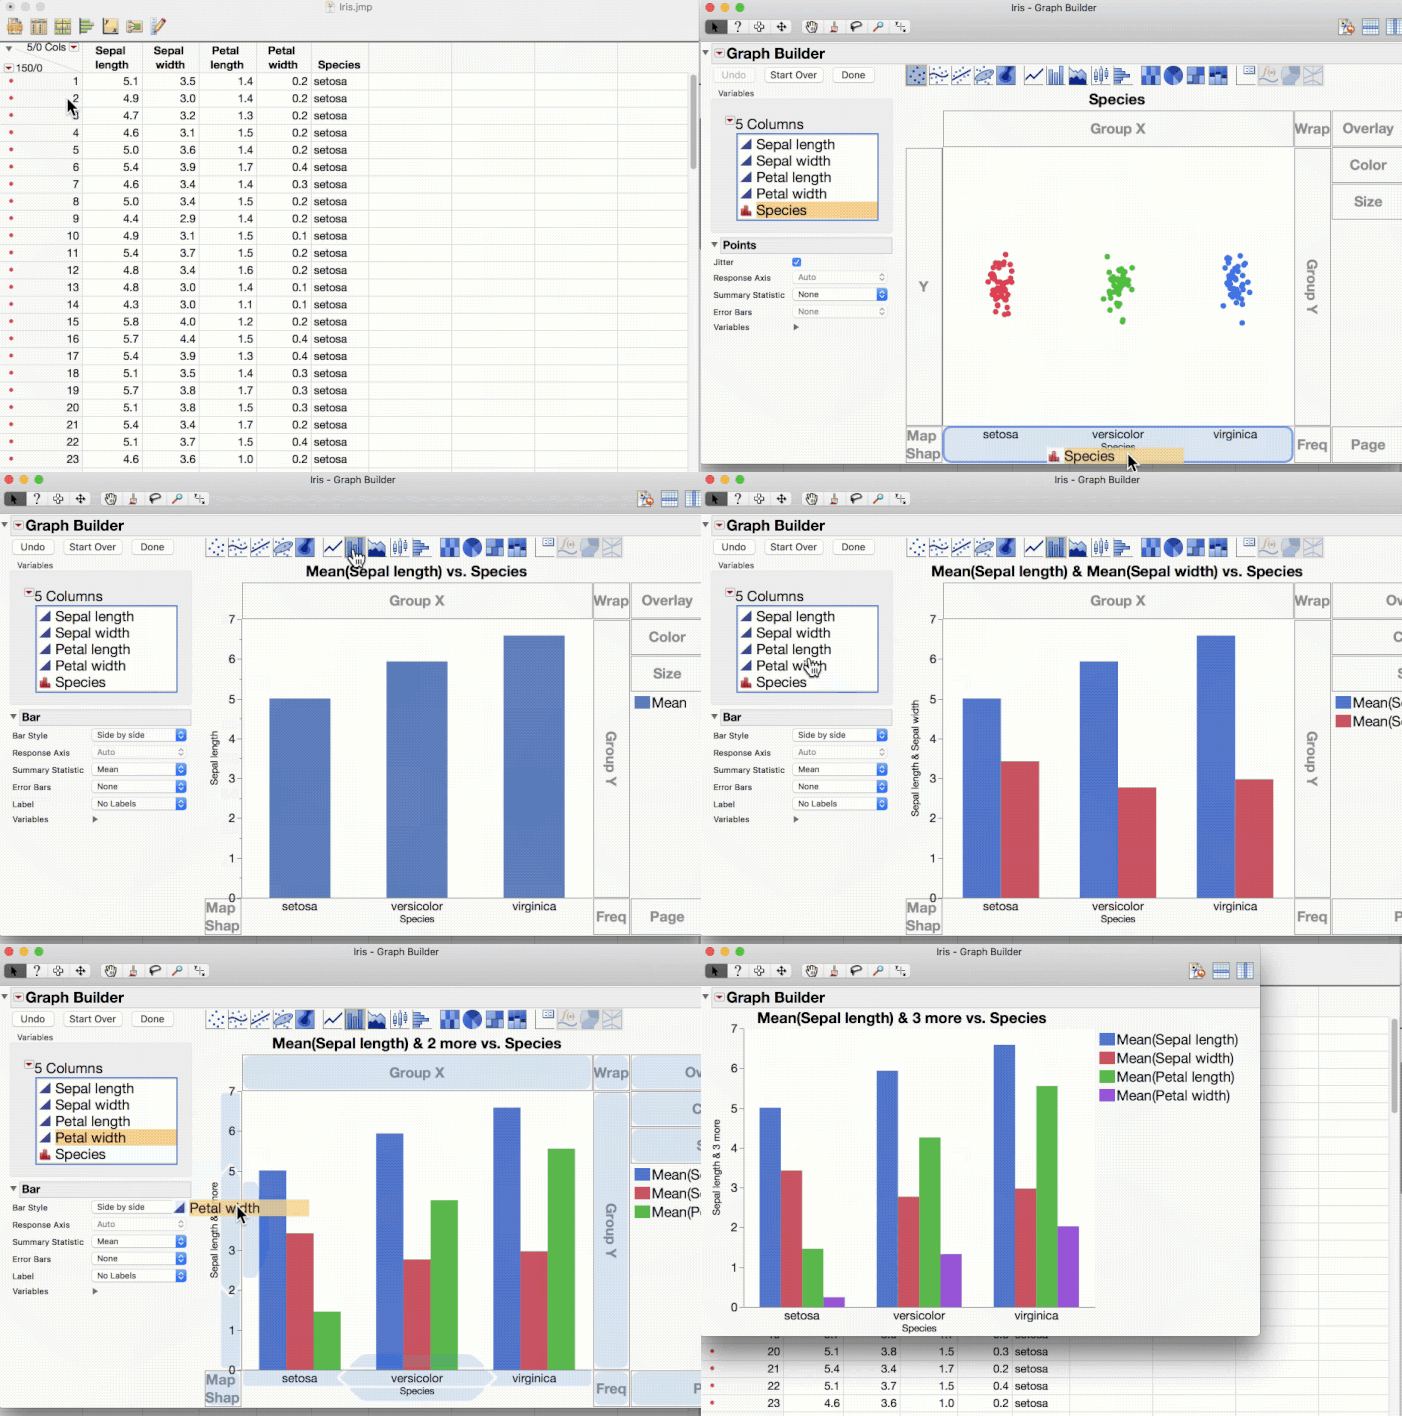
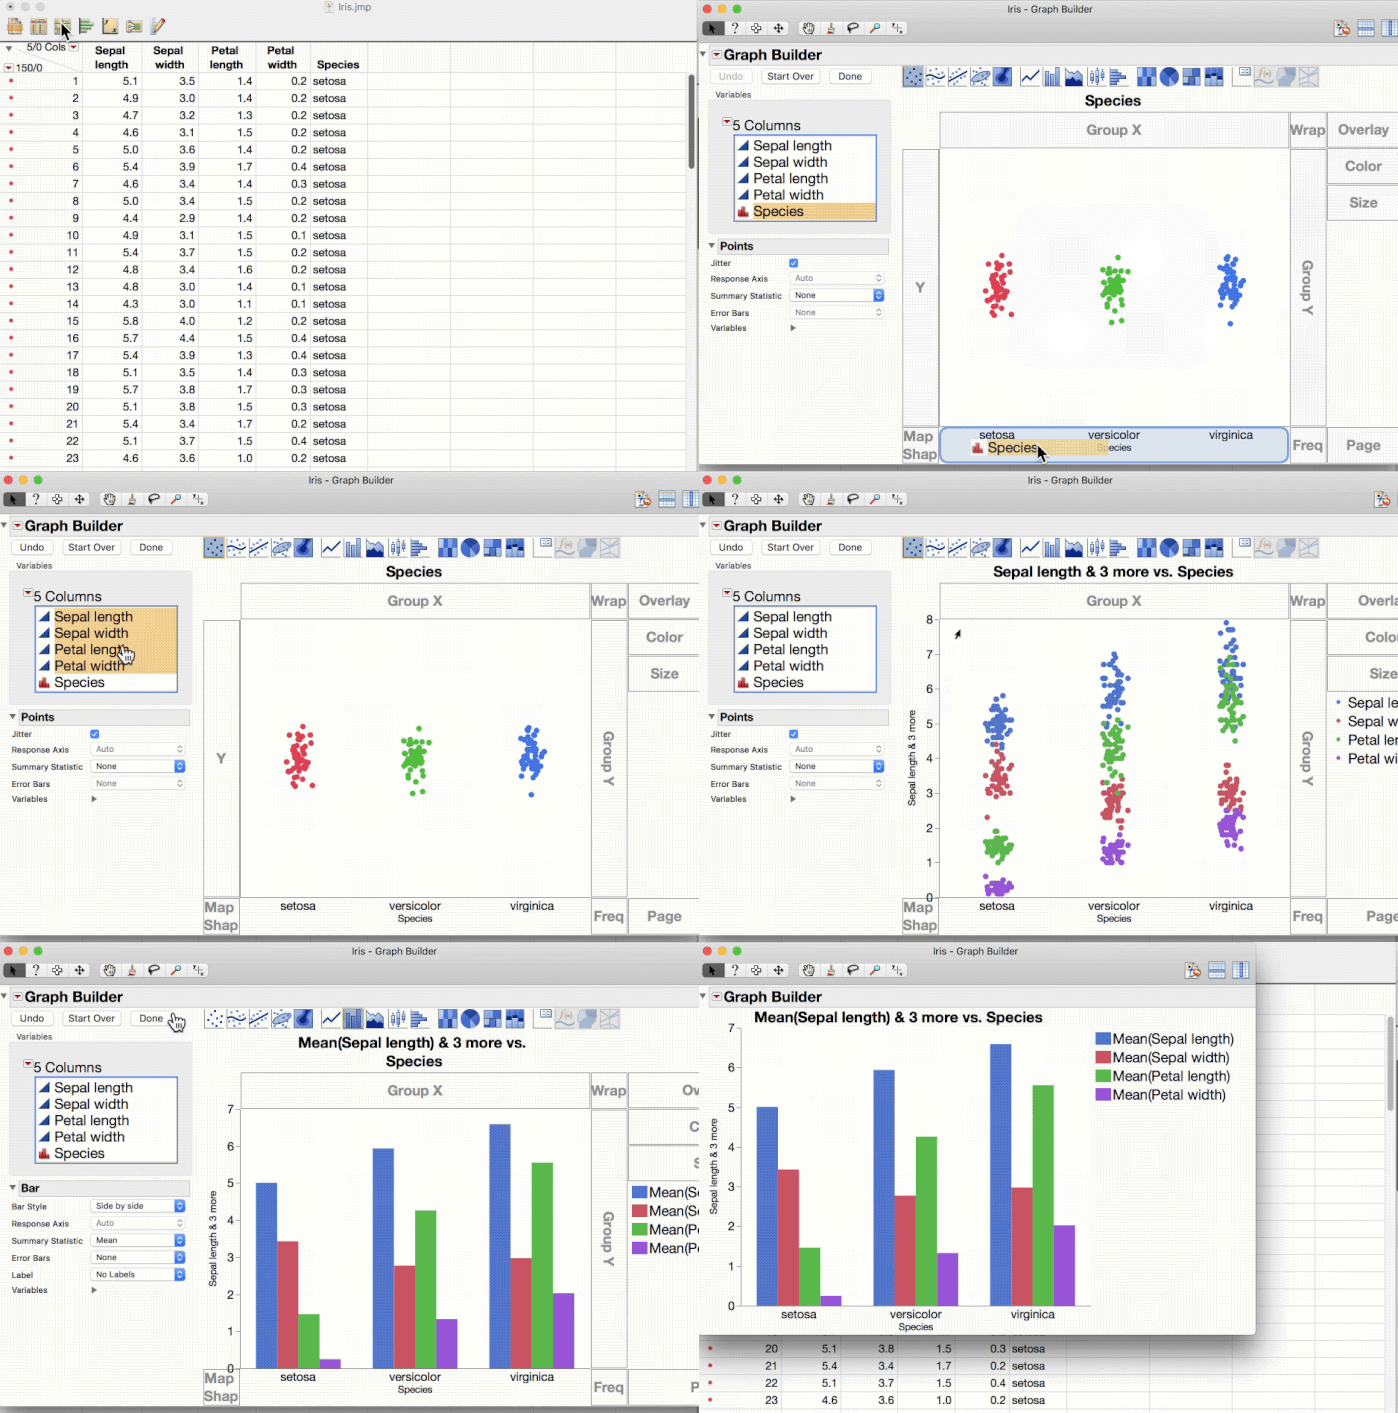
Here are two animated GIFs showing two ways to make a clustered bar chart (also known as "grouped bars" or "side by side" bars) in JMP. The basic idea is to provide a single X variable and multiple Y variables, and Graph Builder will use the side-by-side arrangement by default (see the "Style" property for other arrangements).
The first animation drags in the Y variables one by one, using the "merge" drop zone just inside the Y axis.

The second animation drags in all the Y variables together.

You must be a registered user to add a comment. If you've already registered, sign in. Otherwise, register and sign in.