- Subscribe to RSS Feed
- Mark Topic as New
- Mark Topic as Read
- Float this Topic for Current User
- Bookmark
- Subscribe
- Mute
- Printer Friendly Page
JMP Scripters Club Discussions
- JMP User Community
- :
- JMP Users Groups
- :
- JMP Users Groups by Capability
- :
- JMP Scripters Club
- :
- Discussions
- :
- Re: Graphical User Interface to Automate the Process of Model Tuning
- Mark as New
- Bookmark
- Subscribe
- Mute
- Subscribe to RSS Feed
- Get Direct Link
- Report Inappropriate Content
Graphical User Interface to Automate the Process of Model Tuning
Graphical User Interface to Automate the Process of Model Tuning
As part of Innovation Management at Evonik, we are interested in developing predictive models for some of our quality performance parameters. JMP Pro’s predictive modeling platforms provides a direct path to just that for their practical, real-world problems. However, given the multiple different platforms available: from Neural Nets to Support Vector Machines, and the latest in the XGBoost platform, it can be daunting not only to find which model performs the best predictively, but also in tuning a model. To address this and to simplify the process of tuning models for each platform, I developed a graphical user interface that helps to automate the process of model tuning. The code is written entirely in JSL and utilizes different modeling platforms as well as the DOE platform within JMP. The code spans everything from simple calls and references to more complicated tasks like clicking an “OK” button, extracting data from reports, and passing data from one window to another. The code could not have been possible without the generous help from the JMP Community pages.
- Mark as New
- Bookmark
- Subscribe
- Mute
- Subscribe to RSS Feed
- Get Direct Link
- Report Inappropriate Content
Re: Graphical User Interface to Automate the Process of Model Tuning
Thank you Diedrich for presenting this in last week's JMP Scripter's Club.
I would have a couple of requests:
You mentioned that you had edited the JMP Sample data used in your demonstration.
Would it be possible to get a copy of the edited table posted here.
In your demonstration you showed the results for tuning a NN.
Could you run your analysis , using the same data, on Bootstrap Forest and post your results here.
Many thanks for your contributions to the community.
Philip
- Mark as New
- Bookmark
- Subscribe
- Mute
- Subscribe to RSS Feed
- Get Direct Link
- Report Inappropriate Content
Re: Graphical User Interface to Automate the Process of Model Tuning
Hi @jpol ,
Sure, not a problem. Attached to this post is the modified Powder Metallurgy.jmp file from their sample data.
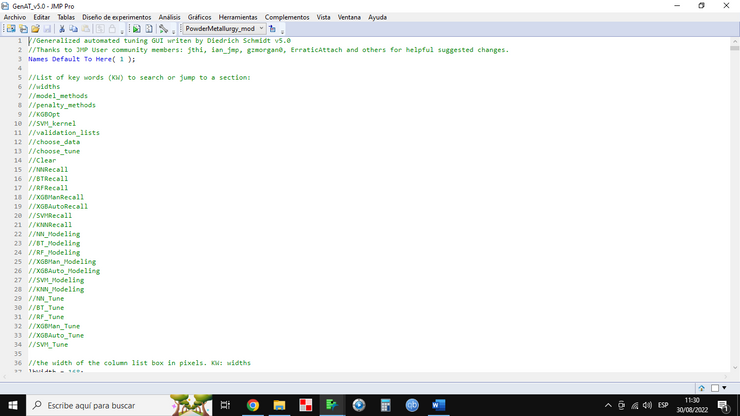
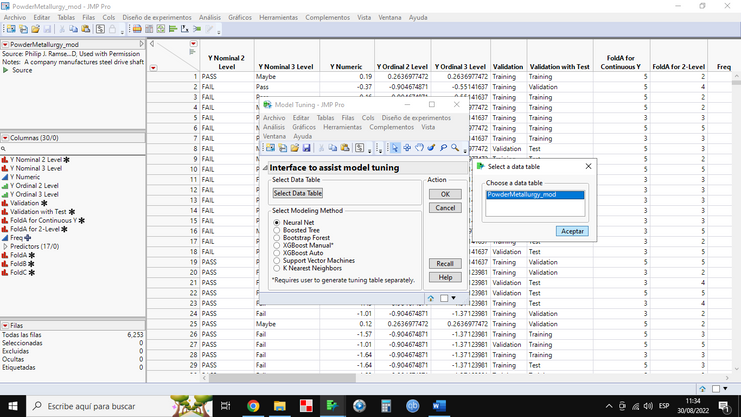
Open up the JMP data table and the JSL file (be sure to be in the data table when running the JSL or alternatively, be sure to select the correct data table used for modeling from the pull-down menu in the JSL window -- see screenshot).
Click on the "Select Data Table" button to select the data table -- this is needed to feed column names to the next window. Select table and click "OK".
Select the modeling method of interest, in this case Bootstrap Forest, then click "OK". Note, the manual XGBoost modeling requires you to generate a manual tuning table and should probably be done only if you are quite familiar in how to do this for XGBoost.
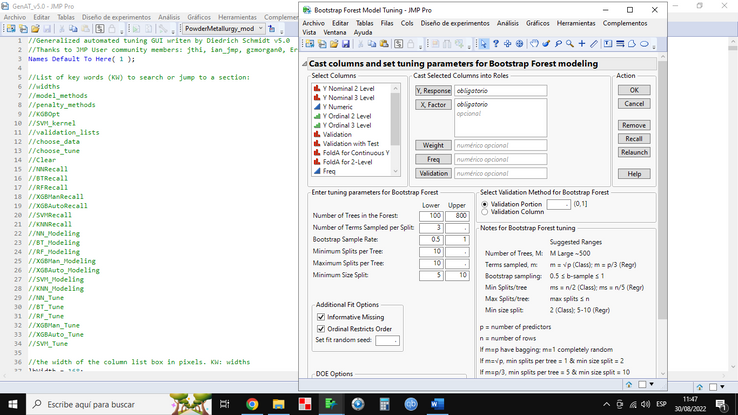
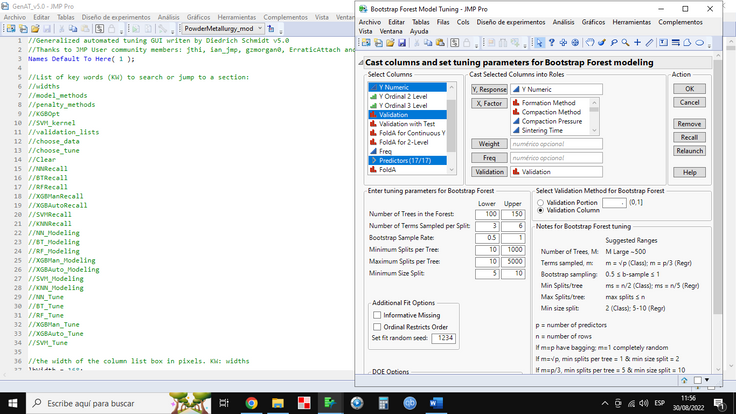
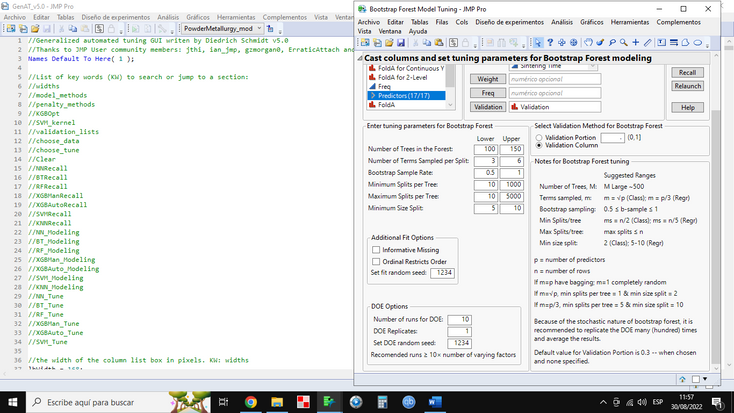
In the next window, you will cast columns into selected roles, set up tuning table parameters, and DOE options. Enter in the values you see in the screen shot below and use 1234 for the random seed for fitting and for the DOE, this should generate the exact same fit table that I have for this post. Be sure to deselect "Informative Missing" and "Ordinal Restricts Order". Then click "OK".
Note, since we are using the Validation Column, the validation method in this window is automatically selected to "Validation Column". If you didn't want to use a validation column, but a holdback portion, leave the validation column selection empty when casting columns into selected roles and enter a number between 0 to 1 when you select the radio button for the validation method. The default is 0.3 (30% of the data) if you accidentally leave it blank.
There's also some notes on setting tuning parameters for each modeling method in their respective tune setup windows. These are just a guide and some "rule of thumb" usage and should not be considered as the only possible options.
Several windows will then popup and disappear -- this is the code generating the DOE tuning table used to pass to the fit platform, and then you should get a JMP window telling you the fit progress -- for the immediate fit. There will also be a small window that pops up giving you the overall fit progress.
Note that even though you put in 10 runs for the DOE, there are 11 total (N+1) because I programmed it to always run a fit using the platform's default settings within JMP. After the fit is done, you should get a window like the one below. You can then use the right/left arrows to cycle through the different runs and tuning parameters while looking at the R^2 fit statistics (and the difference between training R^2 and fit R^2).
Using the table to the right of the graph, select the run that you would like to re-do. If the the "Save results data table" is checked, then you will be prompted to give the table a name and location to save it. The program will re-run just that one fit and display the results. Here, we're re-running Tune 6. I'm also attaching the output data table from the tuning to this post so you can compare with your use.
You should now get a window like such:
Note that the results window from the original tune is still open, this is so you can re-run other tune runs on an individual basis and compare them if desired. You should get the same results as above if you used all the same numbers in the model tuning. After you re-run individual fits, you can of course use the red hot-button to save those scripts to the data table -- it will populate all the parameters for the fit and save the script to re-run the bootstrap forest fit platform to the data table.
Once you are done, you can click "Cancel" to exit the JSL code, or click "Relaunch" to get back to the first window of the JSL code where you can select other data tables and/or fitting platforms.
I'm also attaching the JSL code if you need it.
Hope this helps, and let me know if you have any questions.
Thanks!,
DS
- Mark as New
- Bookmark
- Subscribe
- Mute
- Subscribe to RSS Feed
- Get Direct Link
- Report Inappropriate Content
Re: Graphical User Interface to Automate the Process of Model Tuning
Thanks DS for the detailed explanation and great examples.
I ran the analysis (DOE) as recommended and got exactly the same results that you provided.
A special thanks for the notes on setting tuning parameters for each modelling method.
Looking forward to tuning on my own data sets.
BR
Philip
- Mark as New
- Bookmark
- Subscribe
- Mute
- Subscribe to RSS Feed
- Get Direct Link
- Report Inappropriate Content
Re: Graphical User Interface to Automate the Process of Model Tuning
I'd like to bring it to the attention of those who may wish to evaluate this model tuning procedure that it may require JMP Pro as not all modelling methods are available in standard JMP.
- Philip
- Mark as New
- Bookmark
- Subscribe
- Mute
- Subscribe to RSS Feed
- Get Direct Link
- Report Inappropriate Content
Re: Graphical User Interface to Automate the Process of Model Tuning
Hi @jpol ,
Yes, that is correct, this JSL code requires the user to run JMP Pro 15 and higher. Version 15 and up is needed as versions before 15 did not have the XGBoost platform as an add-in. Also note that there is a known bug in the JMP Pro 16.0.0 version that causes JMP to crash when trying to model categorical responses with the XGBoost platform. This has been corrected in the JMP Pro 16.1.0 release.
Thanks for bringing it to people's attention about Pro for this script. I thought I mentioned it in the Scripters Club meeting, but might have forgotten to do so.
Thanks!,
DS
- Mark as New
- Bookmark
- Subscribe
- Mute
- Subscribe to RSS Feed
- Get Direct Link
- Report Inappropriate Content
Re: Graphical User Interface to Automate the Process of Model Tuning
Hello Diedrich, excellent idea... I don't know what I could be doing wrong... why GenAT_v5.0.jsl doesn't work.
I await your kind guidance,
Cheers,
Marco
- Mark as New
- Bookmark
- Subscribe
- Mute
- Subscribe to RSS Feed
- Get Direct Link
- Report Inappropriate Content
Re: Graphical User Interface to Automate the Process of Model Tuning
Hi @Marco1 ,
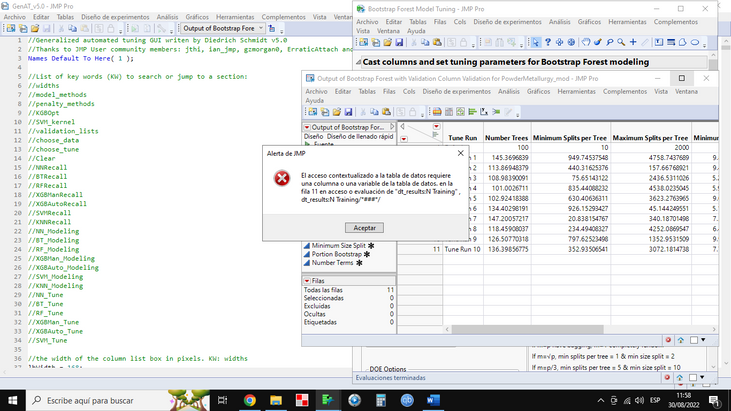
I'm not really sure why you're getting the error message, other than the script needs to have a data table with that column name in it, which it should make automatically. Are you trying to follow the example that I showed above? If you follow the above example, you should get the same result that both Phillip and I got.
It looks like you're trying to do the above example, but it appears as if you're missing columns in your output data table. The output data table should have 16 columns in it, but it looks like yours only has 7. Do you know what happened to the other columns? If you could share more screen shots at each step, kind of like what I did above, that might help me to figure out what's going wrong. Or, if I could see the embedded log when you try and run it and get the error, I could look in the code to see where the error is occurring. More information from you about how you're trying to use the code will help to figure out what the problem is.
Thanks!,
DS
- Mark as New
- Bookmark
- Subscribe
- Mute
- Subscribe to RSS Feed
- Get Direct Link
- Report Inappropriate Content
Re: Graphical User Interface to Automate the Process of Model Tuning
Hello Diedrich,
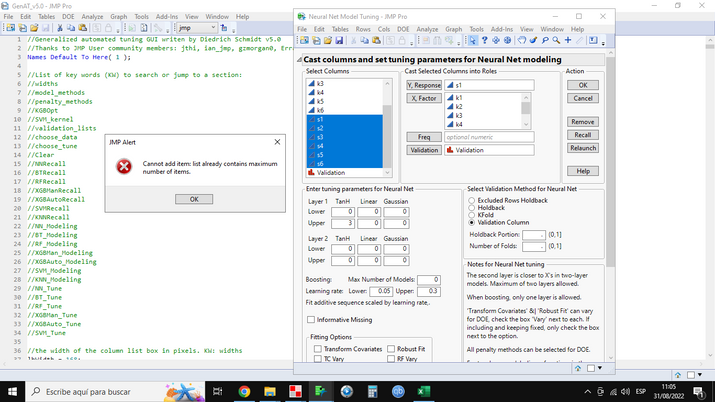
I am pleased to greet you, below I detail the process:
Any additional information you need, let me know.
Cheers,
Marco
- Mark as New
- Bookmark
- Subscribe
- Mute
- Subscribe to RSS Feed
- Get Direct Link
- Report Inappropriate Content
Re: Graphical User Interface to Automate the Process of Model Tuning
There is a possibility that because you are using non-english version of JMP that some columns will be generated with wrong names (I have discussed this with JMP Support as I develop scripts to English and Japanese users and it is a mess...).
One example is line 2241 (N Rows column might have different names on different JMP languages):
dt_resultsSummary << Delete Columns( :N Rows, :R² Diff );Could you maybe try changing JMP's language to English and rerun the script to see if that could be the problem?
- Mark as New
- Bookmark
- Subscribe
- Mute
- Subscribe to RSS Feed
- Get Direct Link
- Report Inappropriate Content
Re: Graphical User Interface to Automate the Process of Model Tuning
Hi Jarmo,
Smart observation, where can you change the language from Spanish to English?
Cheers,
Marco
- Mark as New
- Bookmark
- Subscribe
- Mute
- Subscribe to RSS Feed
- Get Direct Link
- Report Inappropriate Content
Re: Graphical User Interface to Automate the Process of Model Tuning
Hi Jarmo,
Clever observation, change the language to English and the example PowderMetallurgy_mod.jmp works ... will it be possible to correct that observation about the language?
Cheers,
Marco
- Mark as New
- Bookmark
- Subscribe
- Mute
- Subscribe to RSS Feed
- Get Direct Link
- Report Inappropriate Content
Re: Graphical User Interface to Automate the Process of Model Tuning
It is fairly annoying to take care of those while scripting but it is possible. It depends a lot on the script what must be done and it is a lot of work to manage all cases (for example with Summary() scripter can use indices of the columns instead of names). In the ticket (7613370838) R&D took it into the consideration that user could "force" column creation to always use English column names, but I have no idea if and when that will be implemented.
- Mark as New
- Bookmark
- Subscribe
- Mute
- Subscribe to RSS Feed
- Get Direct Link
- Report Inappropriate Content
Re: Graphical User Interface to Automate the Process of Model Tuning
Hello Diedrich,
When choosing the 1-layer neural networks along with the 2-layer neural networks to optimize, could the GenAT_v5.0 script list or include in the results the best results of the found 1-layer neural networks and 2-layer neural networks?
Cheers,
Marco
- Mark as New
- Bookmark
- Subscribe
- Mute
- Subscribe to RSS Feed
- Get Direct Link
- Report Inappropriate Content
Re: Graphical User Interface to Automate the Process of Model Tuning
Hello Diedrich,
Could the GenAT_v5.0 script optimize multiple outputs at the same time like Model Screening does?
Cheers,
Marco
GenAT_v5.0 script
Model Screening
- © 2026 JMP Statistical Discovery LLC. All Rights Reserved.
- Terms of Use
- Privacy Statement
- Contact Us


