- JMP User Community
- :
- Blogs
- :
- JMP Blog
- :
- The bread and butter when teaching with JMP: Teaching statistical concepts (2/6)
- Subscribe to RSS Feed
- Mark as New
- Mark as Read
- Bookmark
- Subscribe
- Printer Friendly Page
- Report Inappropriate Content
After my introduction to academic resources, this second post explains how you can teach core statistical concepts by using resources built into JMP software.
Interactive teaching modules

Where to find? In JMP and JMP Pro, open the Help menu > Sample Data > Teaching Scripts > Interactive Teaching Modules. In JMP Student Edition, open the Applets menu (learn more about JMP Student Edition and the schoolwide grant on the JMP Blog).
How to use? The teaching modules are designed for interactive demonstrations in class, but can also be used by students to explore statistical concepts. Many modules can import custom data by choosing an option like “My Data / My Sample,” which makes them also applicable to exercises or assessments.
Each module has a link to an online help document, which explains its usage, all options and many tips to demo statistical concepts most effectively. You can watch a video tutorial showing all modules in the on-demand academic webinar “Using the JMP Statistical Concept Applets”.
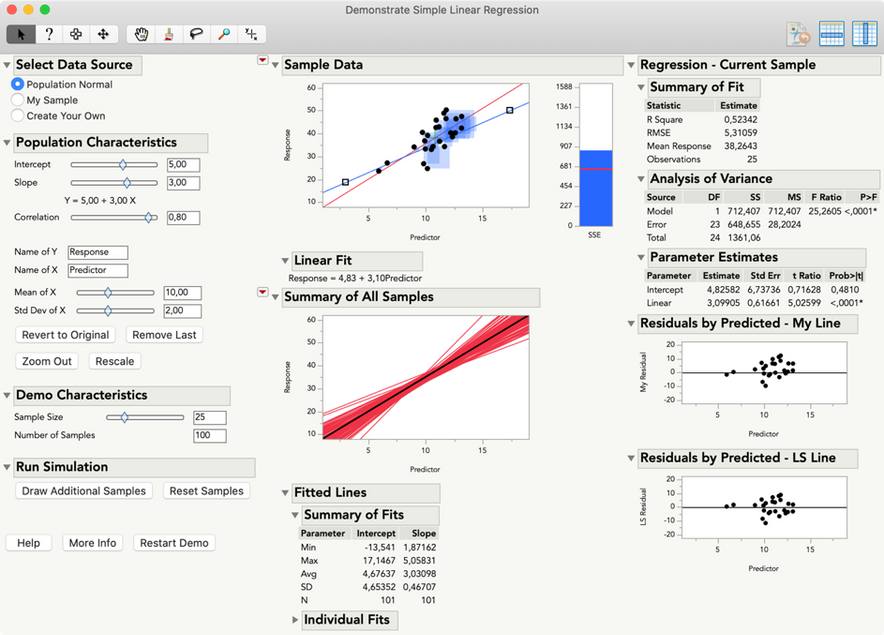
The applet Demonstrate Regression, for example, addresses concepts including “best guess” linear fit vs. least squares fit, residual and sum of squared errors, population characteristics vs. sample statistics, and uncertainty. Data can come from a configurable normal population, can be imported from an open data set or can be self-made by setting all data points manually.

More scripted demonstrators can be found under Help > Teaching Scripts > Teaching Demonstrations (e.g. to demo p-value, power, collinearity or Bayes rule). Some of these animations are also built into JMP platforms, for example, "PValue animation" and "Power animation" in Distribution > Test Mean. You may also find useful teaching tools in the JMP User Community, like "Permutation Test for Two Mean or Medians" or "Demonstrate the Box-Cox Power Transformation."
Calculators and simulators
What is it? The calculators are scripted tools for a handy calculation of confidence intervals, sample sizes and p-values for various hypothesis tests. Simulators are JMP data tables with saved formulas, for example, to create data to show the Central Limit Theorem, simulate dice rolls or produce prim numbers.


Where to find? JMP sample data (Help > Sample Data > Calculators; Help > Sample Data > Simulations). All calculator scripts are also available as JSL source files if you want to change them (Help > Sample Data > See an Alphabetical List of all Sample Data Files > Calculators). For simulators, you can open the stored formulas in the Formula Editor by clicking the ‘+’ icons in the Columns panel.
How to use? The calculators are self-explaining and pretty easy to use; just tell your students where they can be found. To create data in a simulation data table, choose Rows > Add Rows… and set the number of rows you want add, based on the formula for each column. Some simulators also have stored scripts, to analyze the new data by running the script (click the green triangle).
Bootstrapping and simulation
What is it? Bootstrapping, an easy-to-get resampling method for testing sampling distributions of a statistic, and simulation for randomization testing, a resampling method for testing significance, have several advantages: First, key concepts like sample distributions can be introduced empirically without the need to teach extensive theory like probability.
Second, bootstrapping and simulation allow to estimate statistics without knowing the underlying distribution. (See also Hesterberg, T. (1998): “Simulation and Bootstrapping for Teaching Statistics”. In ASA: Proceedings of the Section on Statistical Education, 44 - 52.)
Where to find: In JMP Pro, which comes with every academic site license, Bootstrap and Simulate are just one (hidden) click away. In nearly all JMP reports, students can simply right-click the statistics of interest and select Bootstrap or Simulate.
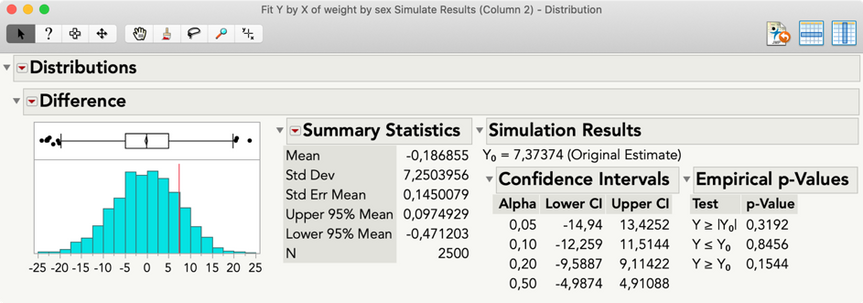
How to use? Bootstrapping asks for the number of bootstrap samples* and creates a new data table, including the statistics for the original sample (excluded row) and for all bootstrap samples. JMP adds a Distribution script to the new data table that shows the empirical confidence limits at different levels.
Simulate requires you to prepare a formula column using resampling with replacement, which will be switched in for an existing nominal column. For a detailed Simulate demo, watch the academic webinar Advanced Research Methods with JMP.
*There are several other options, but as a rule of thumb, keep the defaults carefully set by JMP. For more information, refer to the JMP Help.

The next post presents resources to teach statistical methods, for example, for multivariate analysis, predictive modeling or design of experiments.
Click to see the other posts in this series about teaching with JMP.
- © 2024 JMP Statistical Discovery LLC. All Rights Reserved.
- Terms of Use
- Privacy Statement
- About JMP
- JMP Software
- JMP User Community
- Contact

You must be a registered user to add a comment. If you've already registered, sign in. Otherwise, register and sign in.